Oil quiz
The answers to last week's quiz plus a bonus

Last week, I posted a graph of 7 oil production levels from 2010 through May 2026 for light tight oil (LTO) in the US Lower 48 and Alberta bitumen and other liquids production. The graph had a bit of a twist: I didn’t tell you which was which:
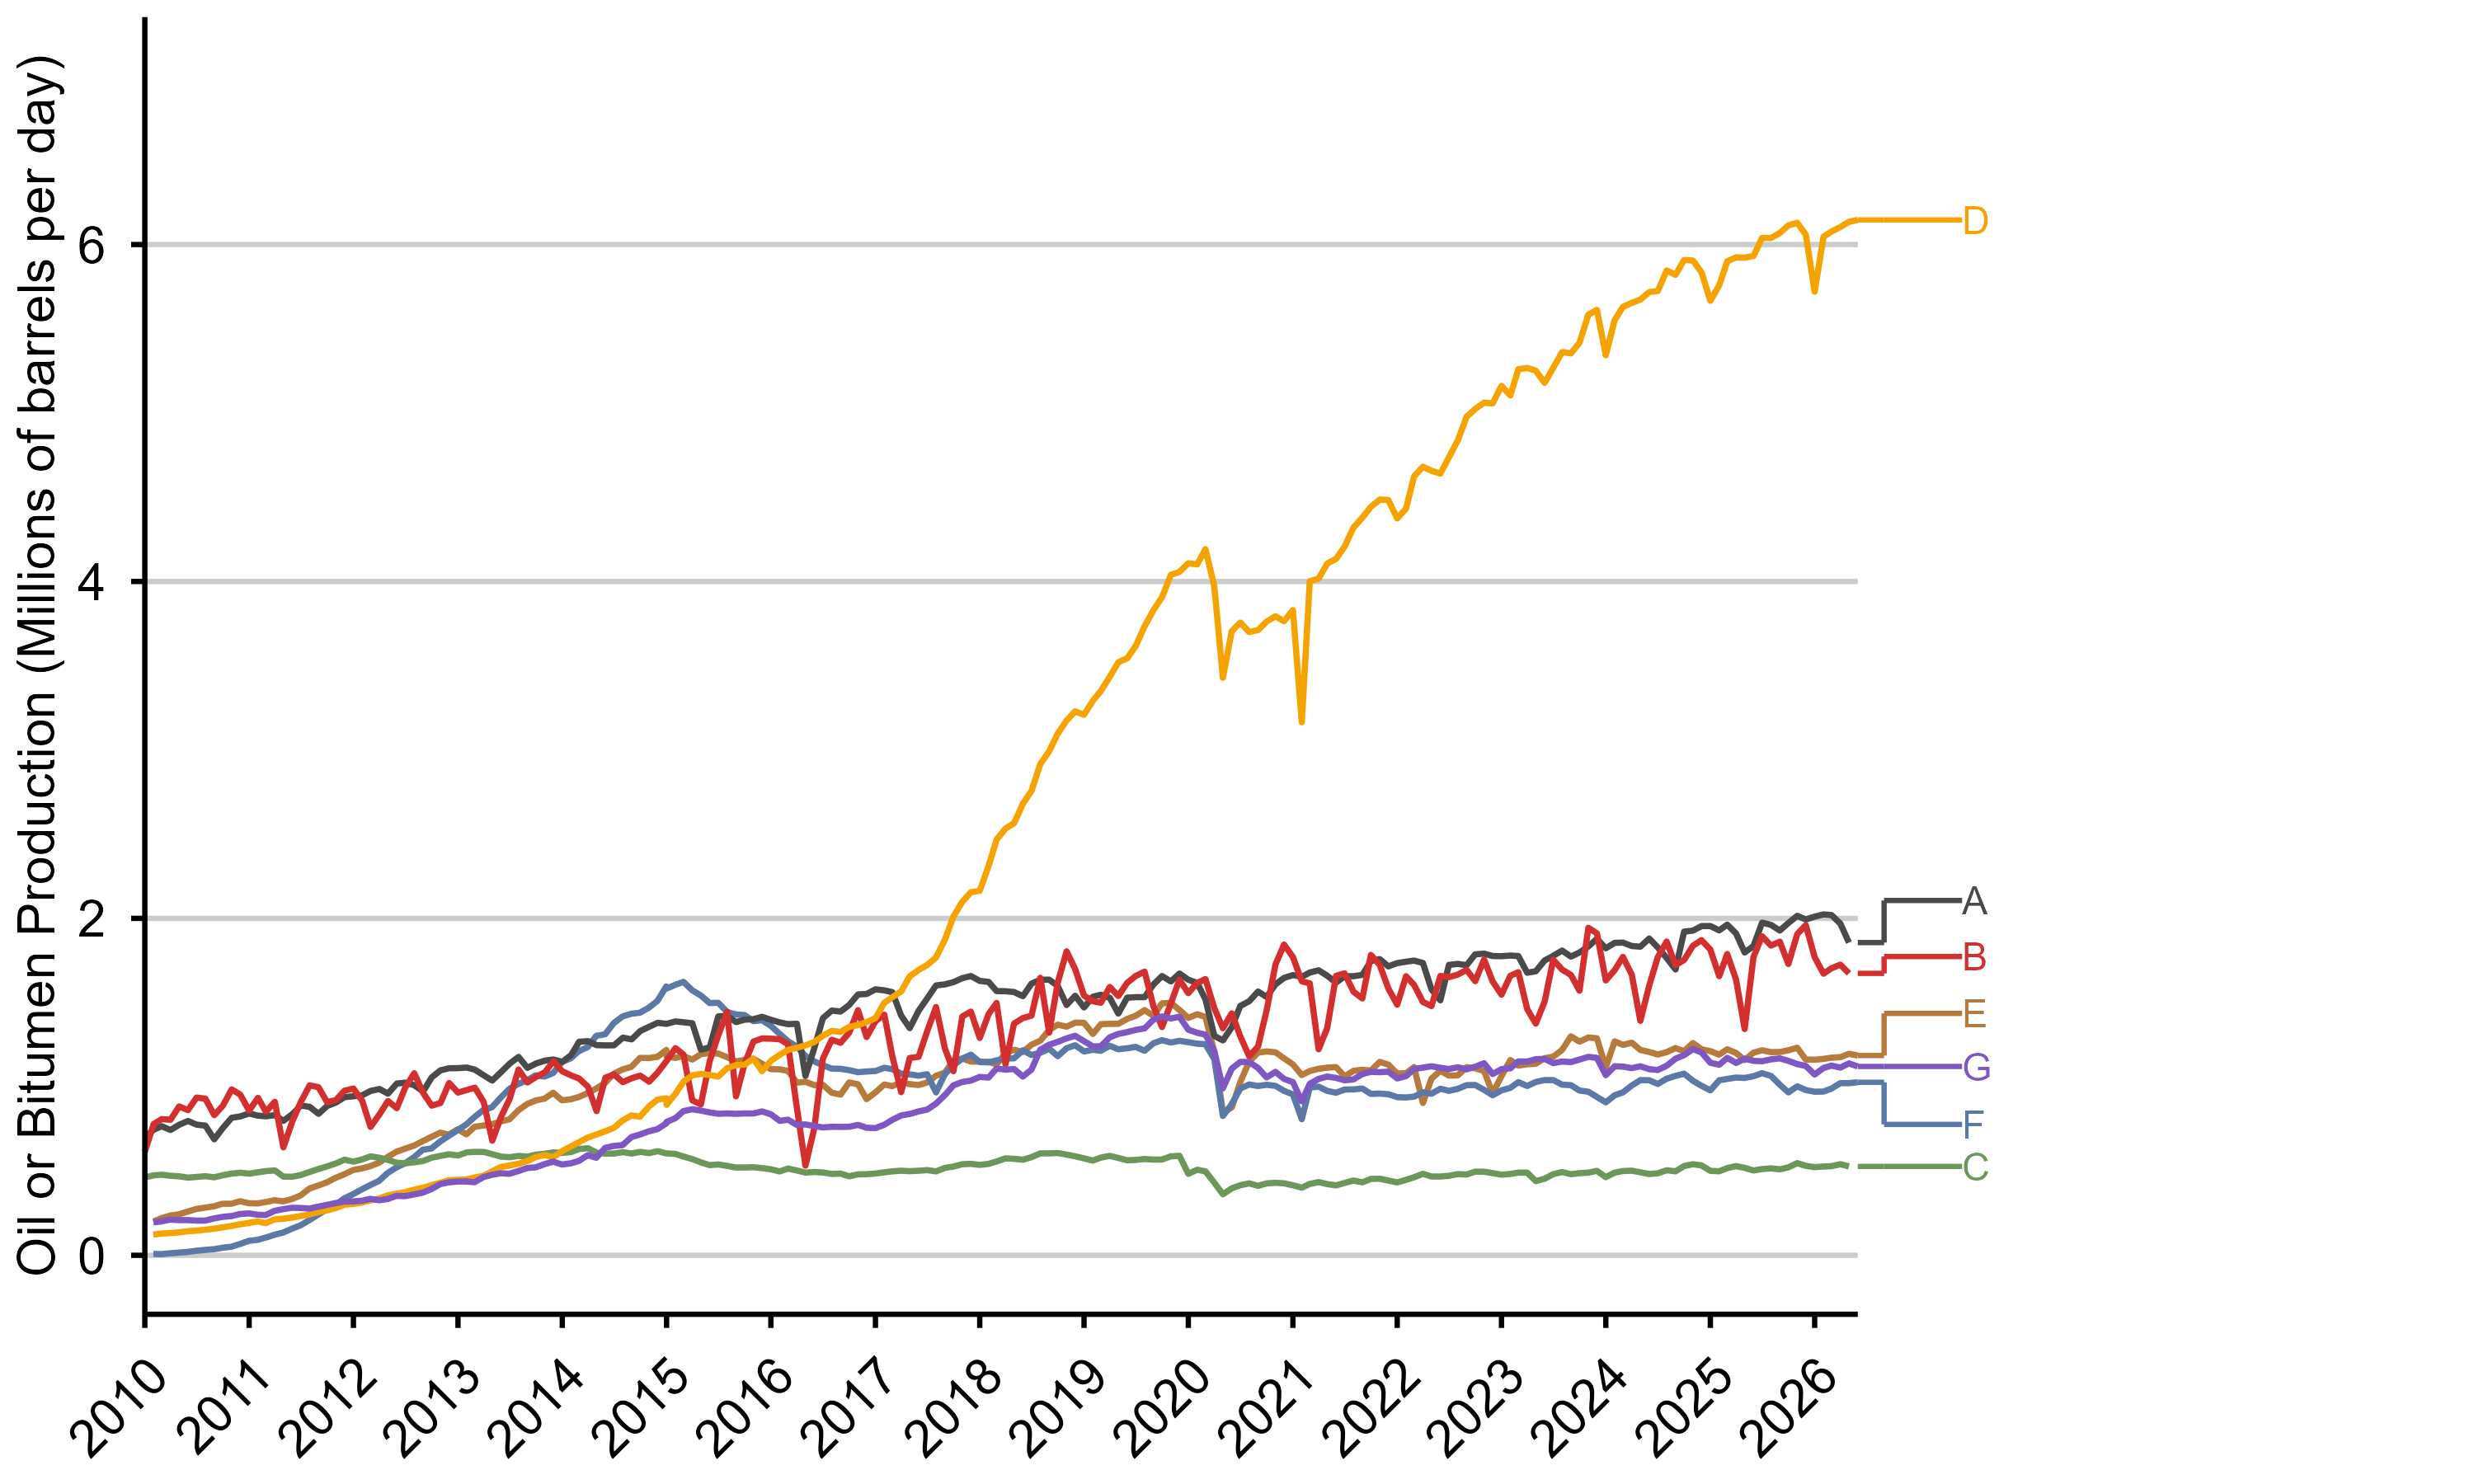
I was curious how people would react, and whether people would be willing to guess which curve was associated with which play. I got some interesting responses.
Here’s the solution key for the quiz:
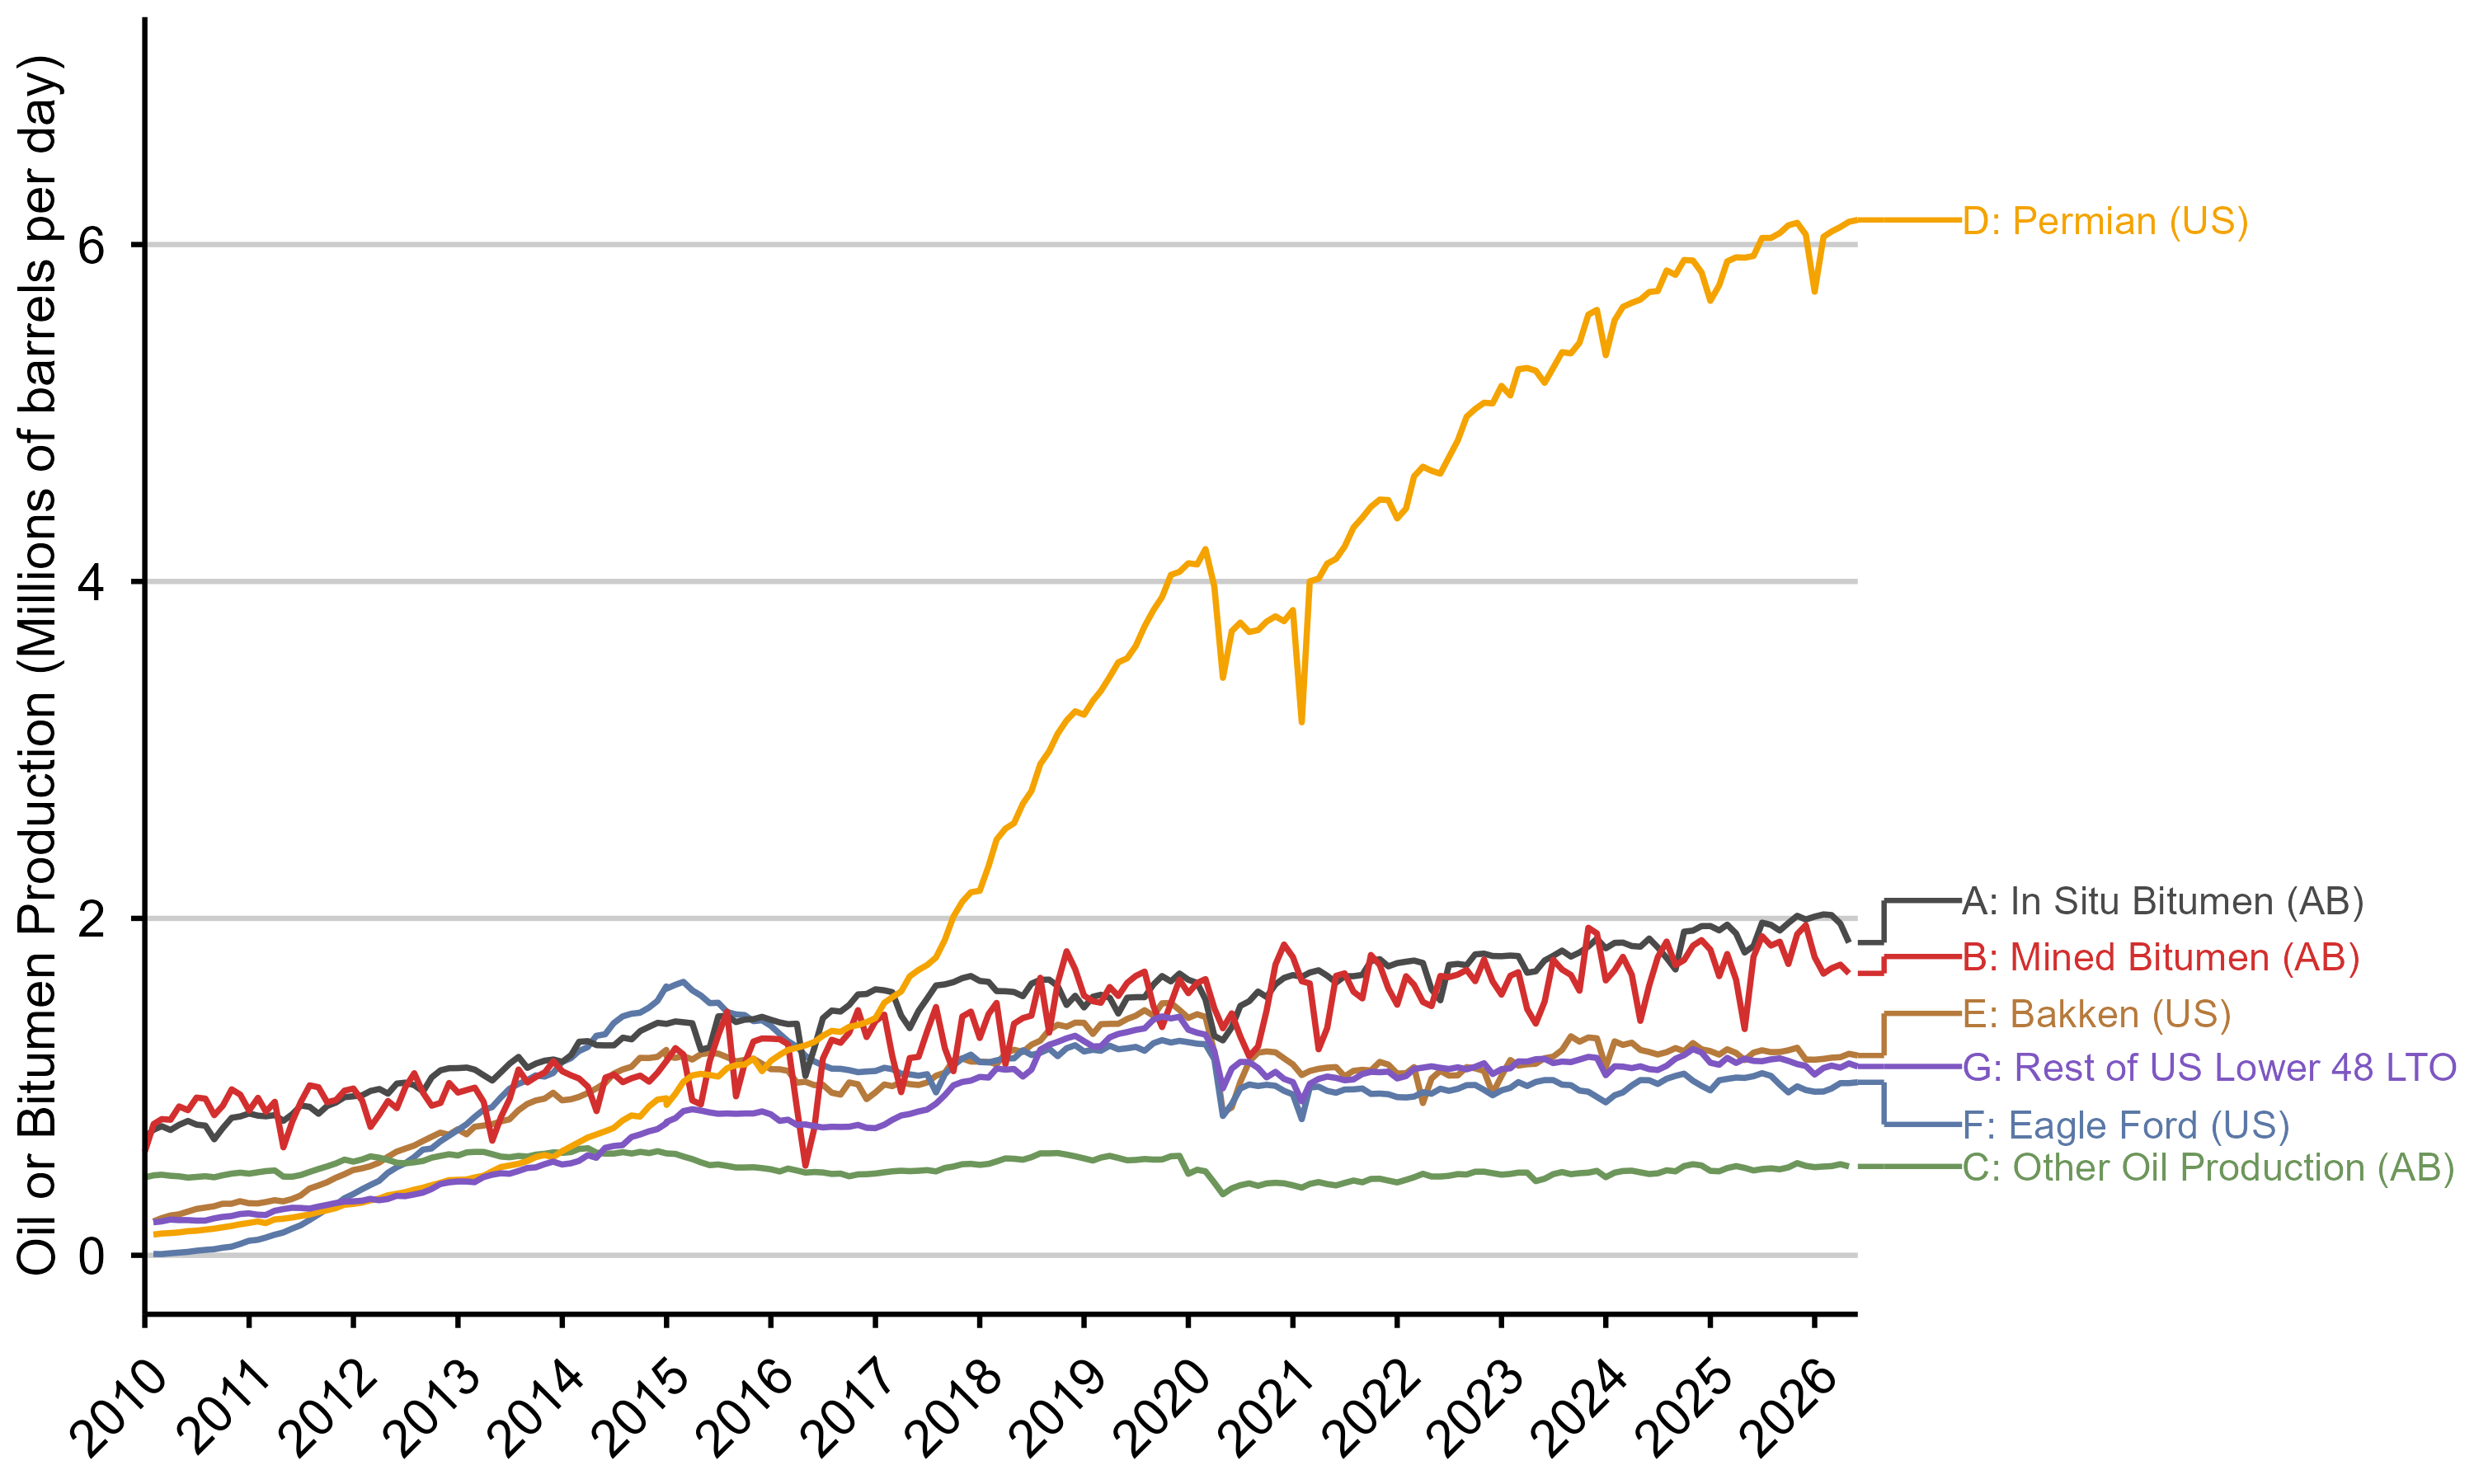
Not surprisingly, the Permian drives most of the production growth in the US, but the rest of this graph might be surprising to some.
The levels hide some of the story, so let’s look at growth rates since 2014 and add a bonus series. Other than the Permian, where production has grown almost 8-fold in 8 years, the rest of the plays mapped are pretty flat with Alberta bitumen and other US LTO plays clustered as the best-of-the-rest with cumulative production growth of 46-70% since 2014. The Bakken formation, closest to Alberta in terms of access to global markets, shows a 10% increase in production since 2014. The Eagle Ford play in Texas, in contrast to the Permian, shows a decrease of 25% from 2014 to today. US Gulf Coast offshore, a resource a bit more comparable to Alberta’s oil sands in terms of cash flow patterns and timelines shows 50% growth over the time period, basically the same as the oil sands.
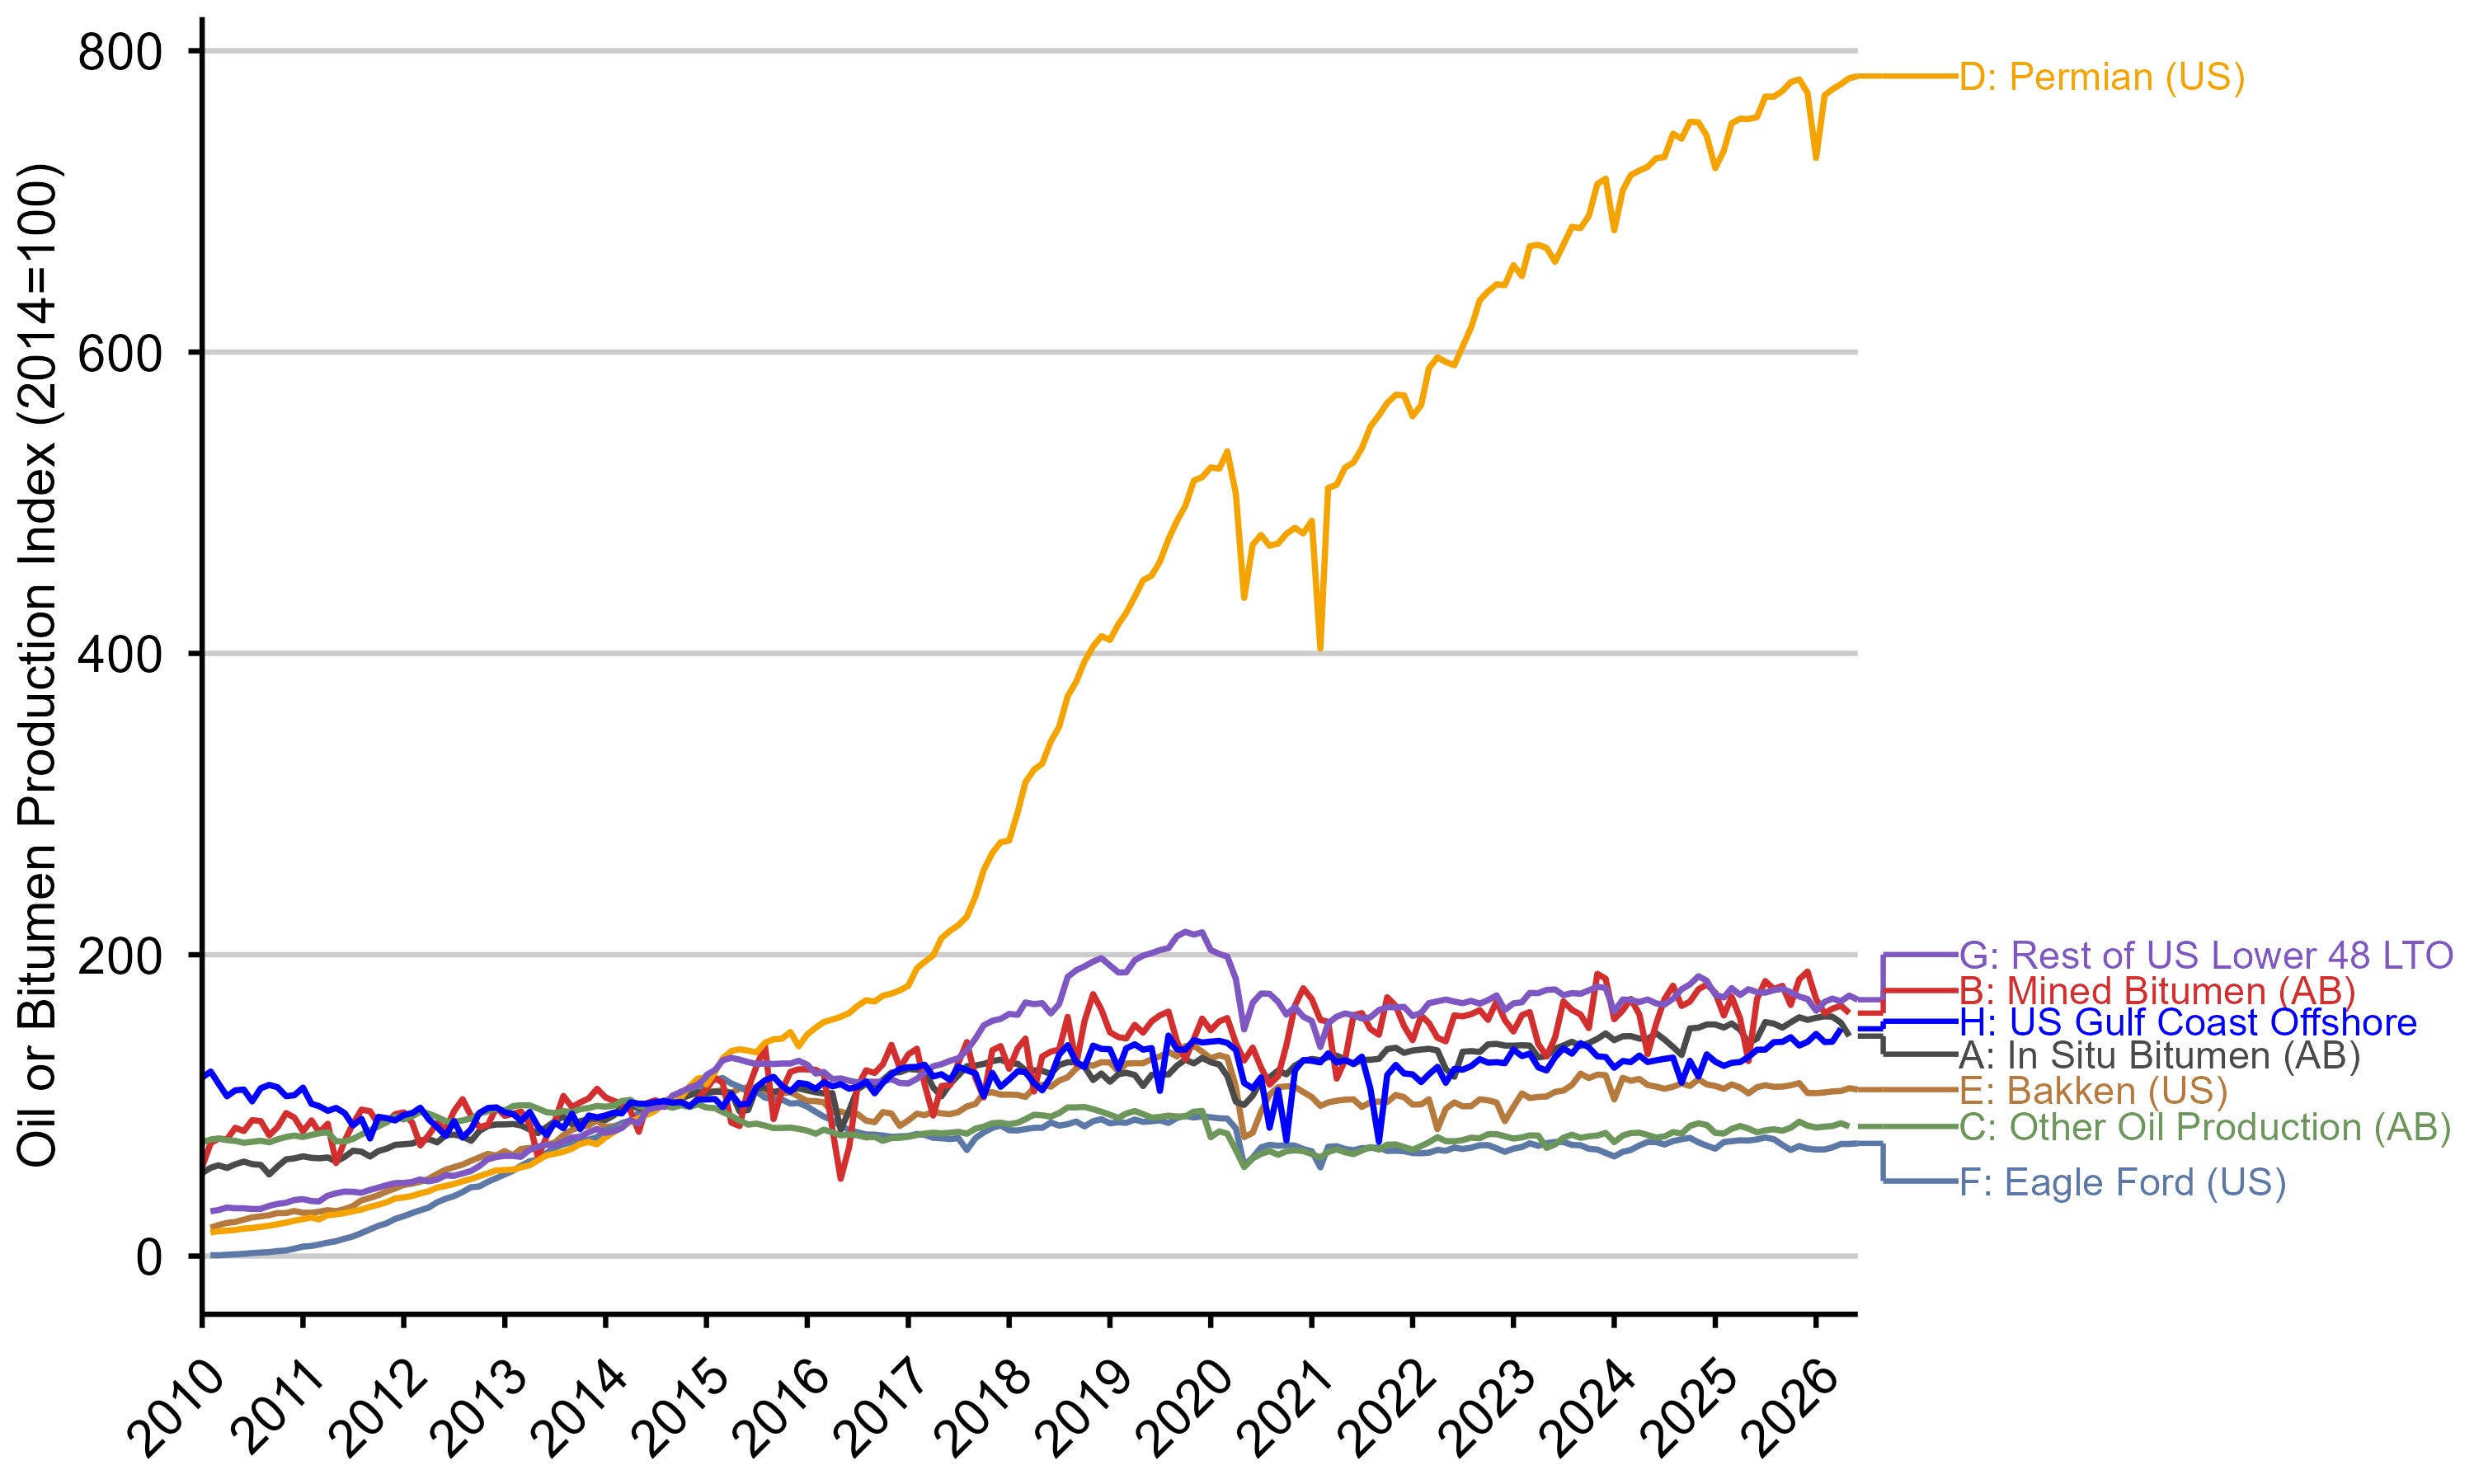
These are all very different oil plays, to be sure. But, if I might hazard a guess: if the Bakken or the Eagle Ford or even the offshore Gulf were in Canada, there would be a whole lot of people blaming the Liberal government of Justin Trudeau for sluggish growth or even declines in production.
To be a bit more helpful and less snarky, might I suggest that rather than looking at US production as a whole and projecting that as a potential for Alberta, break down the individual opportunities and look at how policies and changes in prices might have impacted production growth. And, be careful to compare apples to apples.
If you’ll allow me to speculate, the biggest changes we’ve seen since 2014 has been a steady increase in the estimate of available global oil supply at lower prices, including from the US and Canada. These changes, on a global basis, have meant that underlying crude oil price projections have declined appreciably, as shown in one example below. For example, the EIA’s 2026 Annual Energy Outlook forecast a real Brent crude oil price of less than $70, increasing by 0.90% per year, which is the lowest price forecast we’ve seen from them in decades.
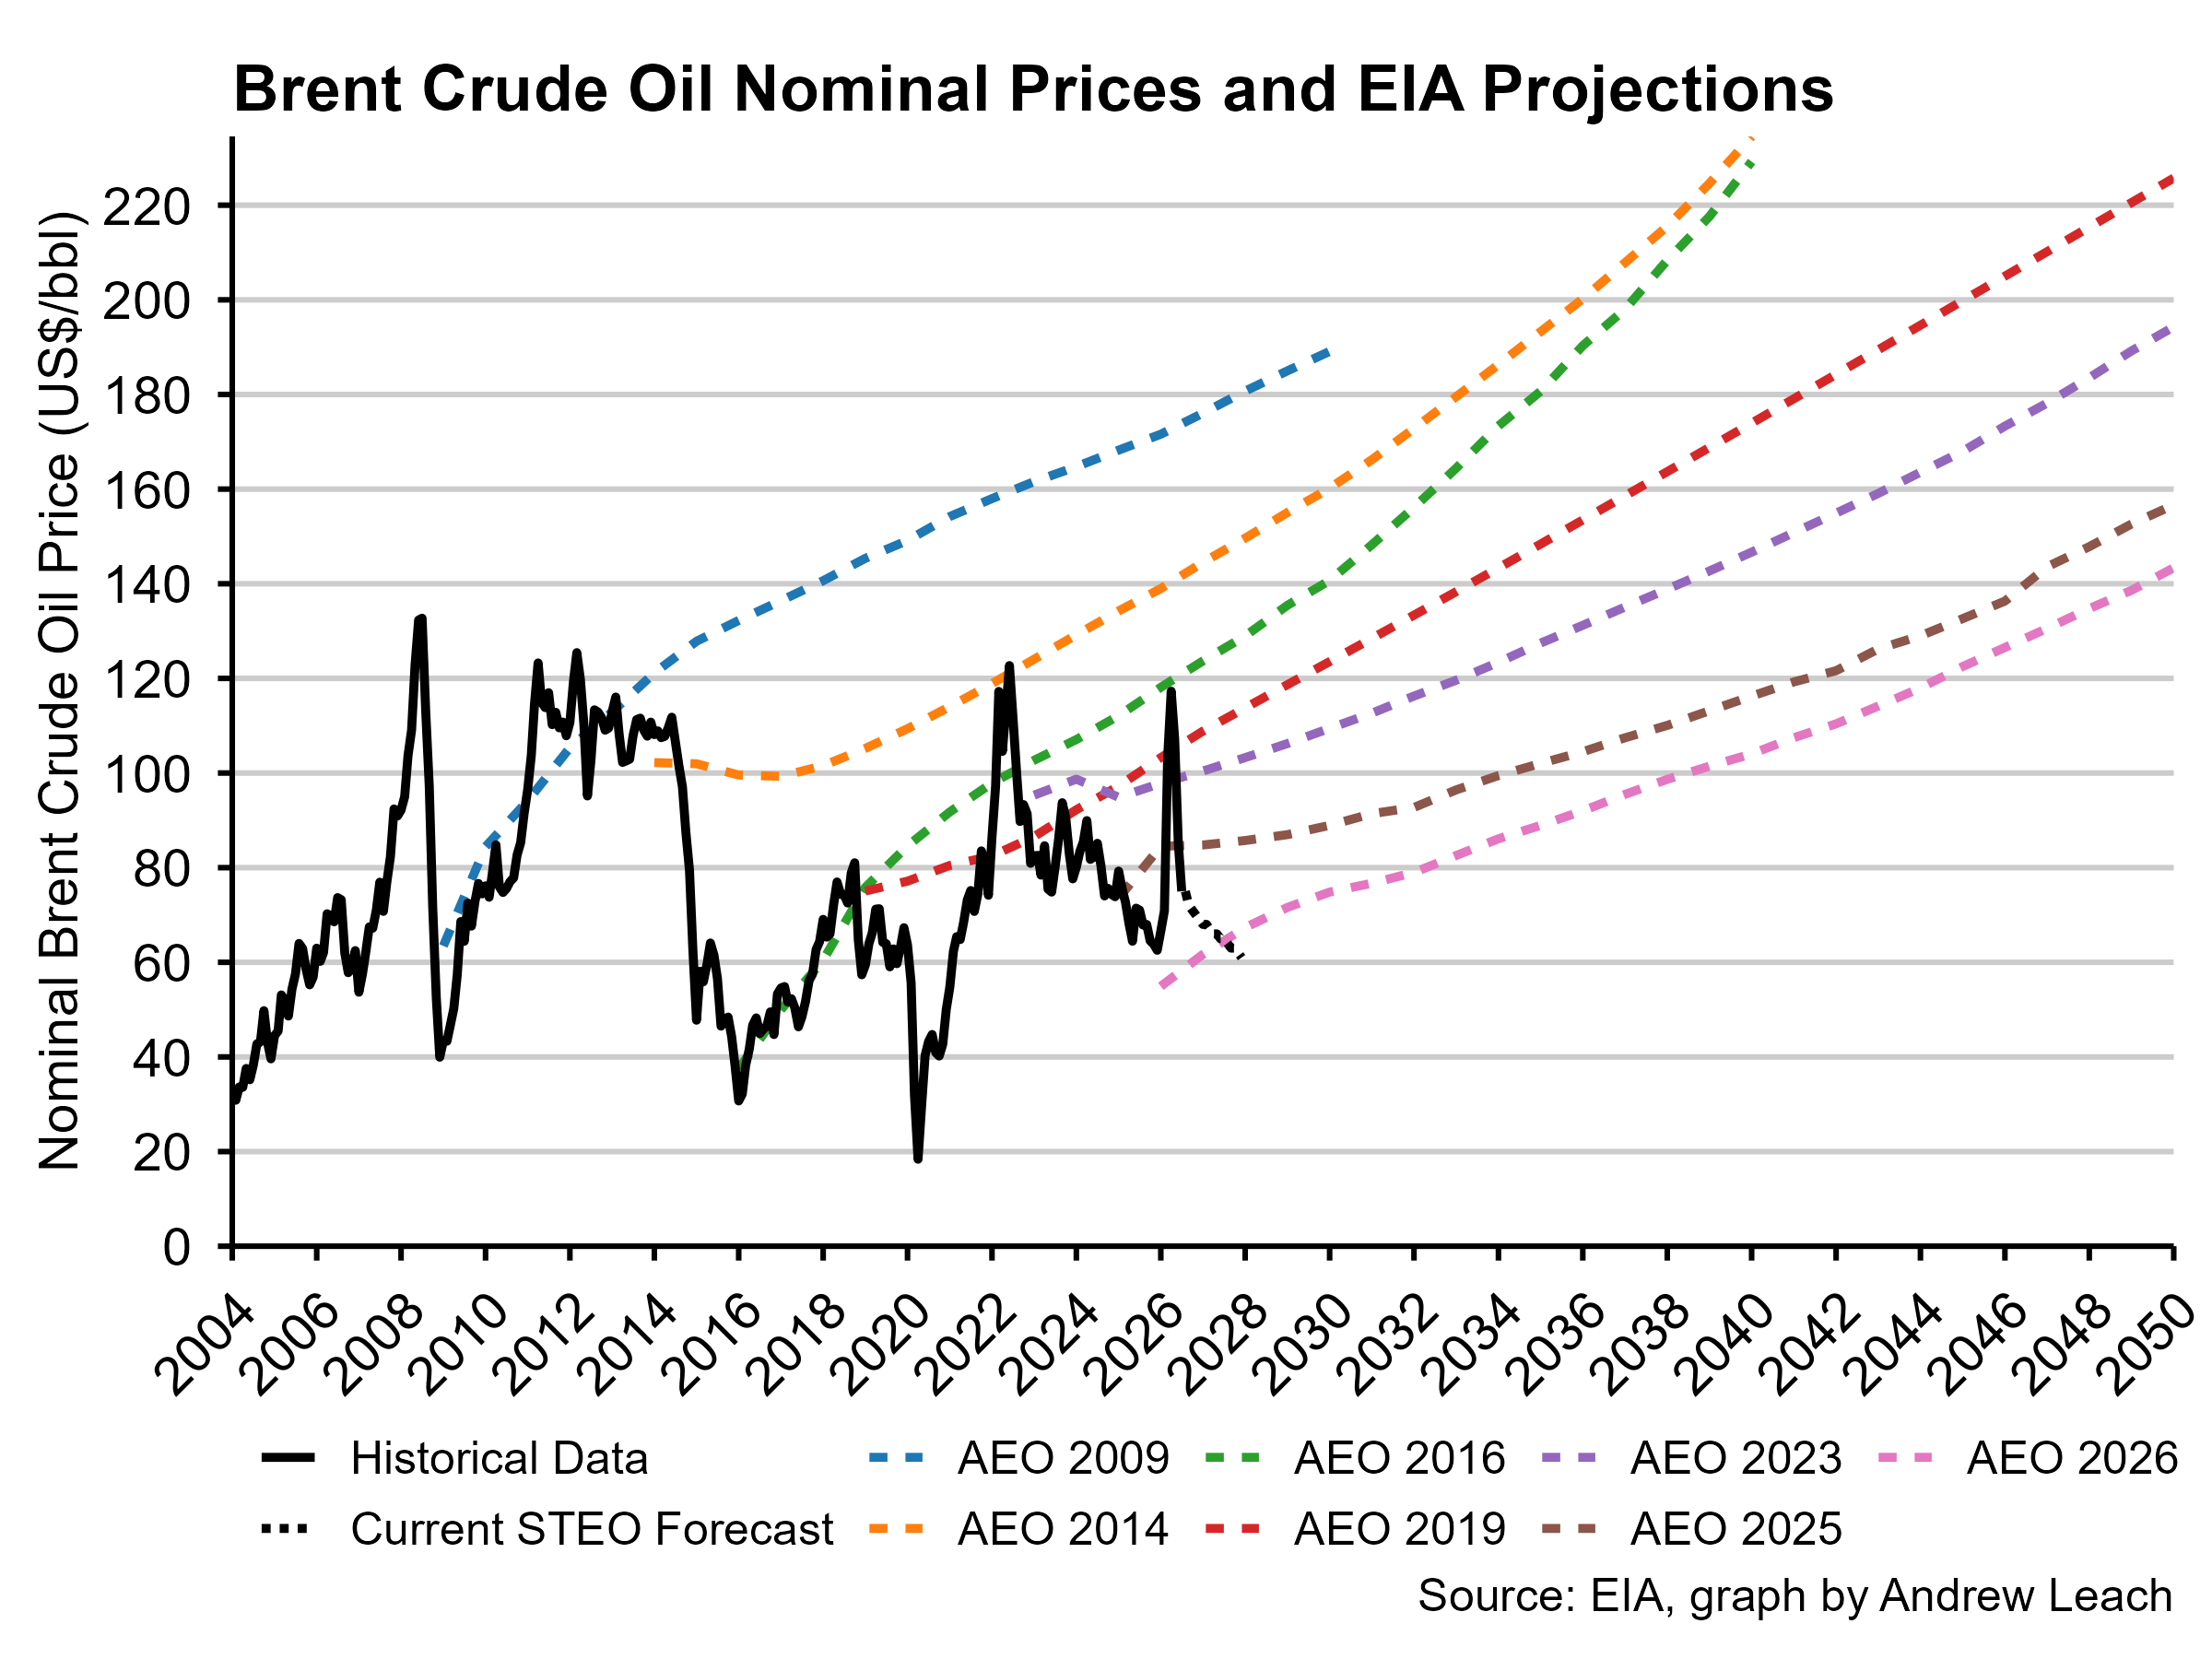
These price levels are high enough to sustain current and some increased production in the oil sands, if they materialize. But, as we have recently endured a return to triple-digit oil prices for a short time, it is worth remembering that the very bullish sentiment that was present in Alberta and elsewhere into 2014 was grounded in a view that double digit oil prices were a thing of the past.
If the downward revision in crude oil outlooks continues, it will have little-to-no impact on wells drilled today in US light oil plays, since these wells deliver most of the oil they will ever produce in the first few years of production and, if desired, production can be nearly fully hedged in a very liquid market. An oil sands project, by contrast, would be lucky to start producing oil in three years after a final investment decision was made, and will likely continue producing beyond the time horizons shown in the forecasts above. We’ve seen the systematic under-estimation of the oil industry’s capability to find and produce oil at low prices and, if that continues, it will affect oil sands projects more than most other resource plays.
More to come on this later, but I hope you find these thoughts interesting in the meantime.
Andrew,
Why do you always allow facts to get in the way of my well informed opinions lol. I had no idea that the Permian production had grown that much since 2014. I agree that there is an increasing narrative that oil prices might stay range bound in the $60-80 range for the next 10 years for a variety of reasons, which will impact massive oilsand build out like we saw in the pre-2014 era. While we cannot know, I do wonder what Western Canada production growth would have looked like if the Northern Gateway had been built. Also if your thesis is accurate the new west coast pipeline might not fill up as quickly as many are assuming.
So, by the Can. Federal Government's own calculations (Administrative Burden Baseline), the enormous and ever-increasing regulations, regardless of the newly minted Red Tape Reduction Action Plan, when heaped upon the U.S. EIA's slightly falling crude price outlook, can't help but harm investment appetite. Since bureaucrats beget bureaucrats, the 100,000 new positions created during the Justin Trudeau decade tend to reinforce his self-fulfilling prophetic "There's no business case" attitude.