
December 9th
December 9th
Keystone spill, oil prices dropping, student stories return, and my year-end solar review

Happy Friday.
This week’s energy charts are posted at https://aleach.ca/charts. A few missing charts this week due to another EIA API outage.
Our lead story this week is the 14,000 barrel spill on the Keystone pipeline in Kansas. That’s a big spill - one of the largest on-shore spills in US history - and it will raise more questions about the safety of the controversial Keystone project.
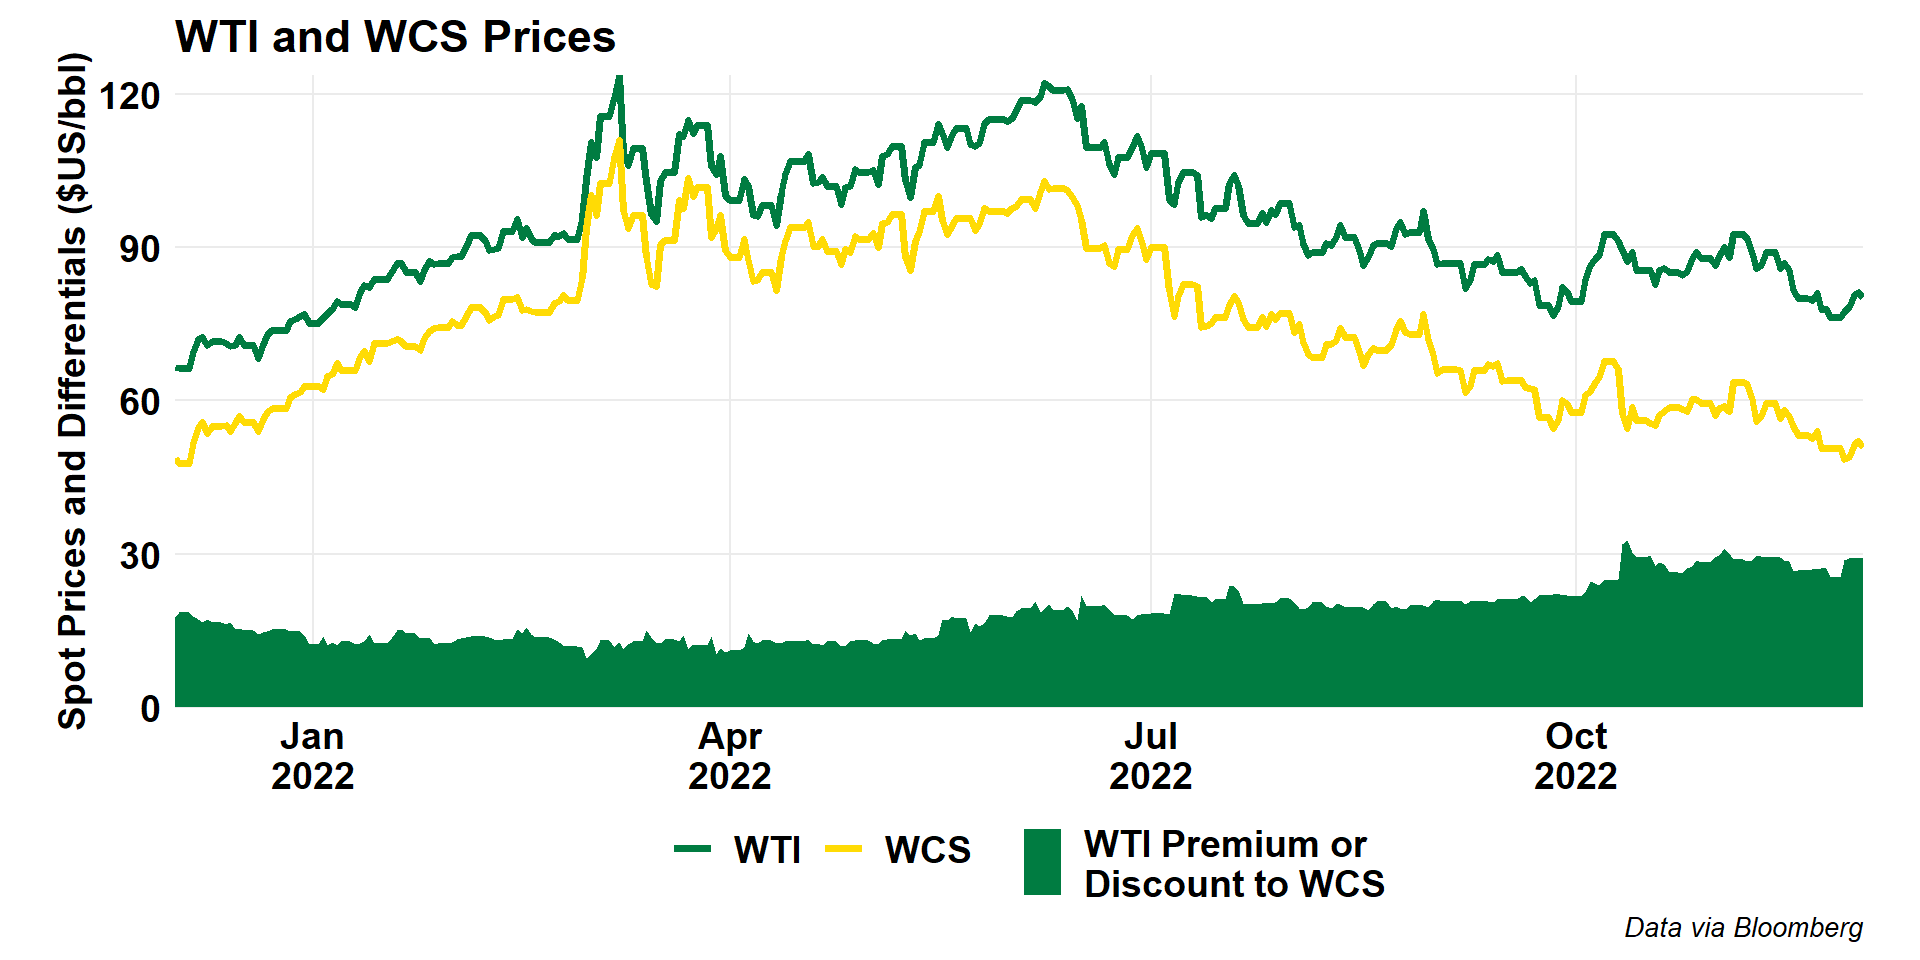
The Keystone spill is also bad news for an already tumbling western crude oil outlook. Discounts on Canadian crude have been steep all Fall, and if Keystone is offline for any length of time, this will get worse quickly. Combine this picture with another $10 per barrel drop in crude oil prices this week, and there’s a lot of bad news for Canadian oil producers.
Our students (exam procrastination is real!) have additional stories this week on Canadian oil majors’ investment outlooks, renewable energy for remote northern regions, and the IEA Renewables outlook.
Normally, we’d be doing EIA STEO charts since it was out this week, but that’s squashed due to the API outage. You might see some bonus charts this weekend (grading procrastination is real!). In lieu of the STEO, I’ve got two items for you this week, both focused on Alberta electricity.
First, for Jason Kirby’s annual chart week (now at the Globe and Mail), I’ve decided to focus on the evolution of Alberta’s electricity mix and the pending coal phase out. I wanted a simple chart that really got the point across, so here it is:

This week, I also decided to update my solar power reports for my household system (7.6kW, south-facing in Edmonton), and I thought I would share a couple of those.
First, it turns out that the sun doesn’t shine all the time. While this may not be shocking to many of you, I can assure you that I will receive at least one reply emphasizing the point. As you can see, while our days are highly variable, the monthly average pattern is quite predictable from year-to-year.

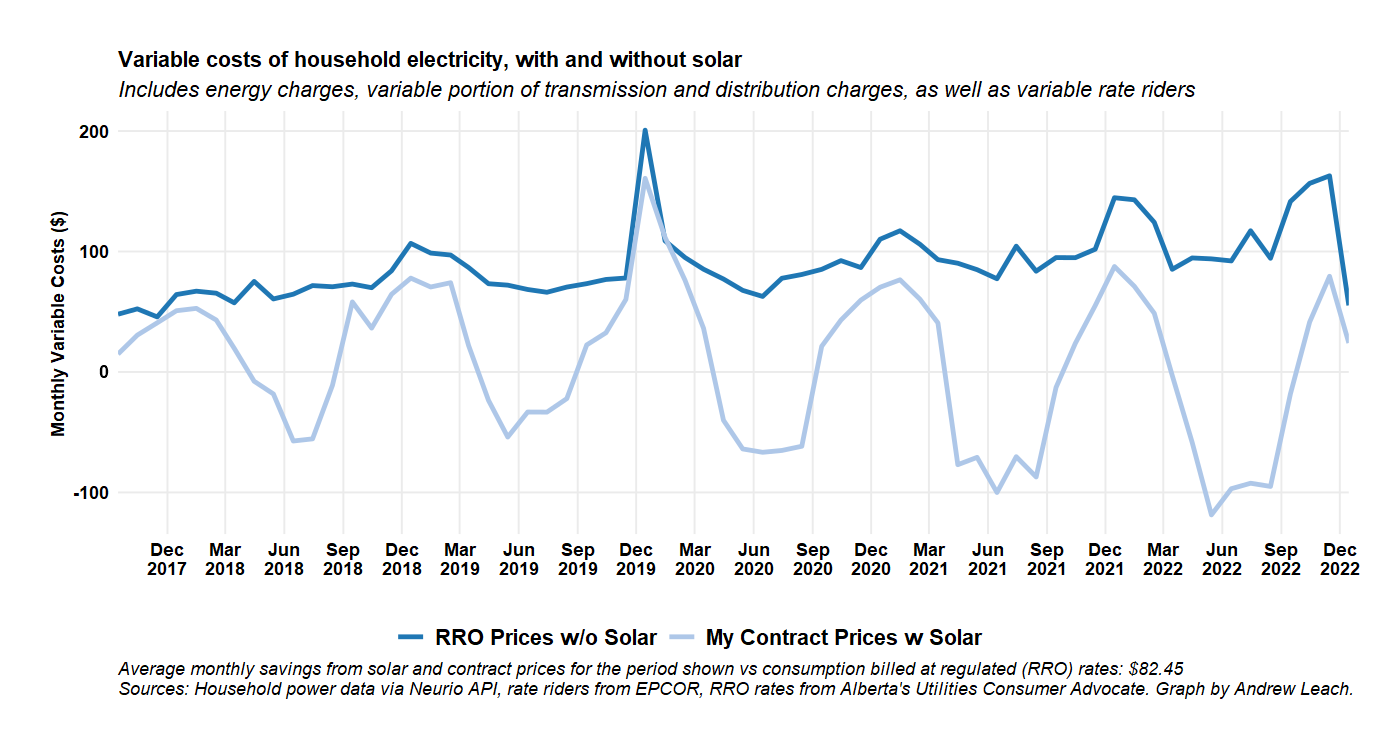
You might be interested in how the system is performing financially, and so far it’s much better than expected. The recent high prices haven’t changed matters much since I am generally on a high-priced contract over the summer. The winter will see some larger bills for sure, with December and January likely to see my highest bills since we installed the system, and not much generation as you can see above. Still, we’re saving about $82/month from our solar system, and the system cost us a bit more than $13,000 to install in 2017. If this keeps up, we’ll see a subsidized return of about 5.5%, while the unsubsidized return would have been about 2%.
And, finally, here’s a sense of how far we are from net-zero overall. We’ve had two years (2017-18 and 2021-22) where we’ve generated more than we’ve used but, since we installed the system, we’re about 320kWh short. We have 27 panels on the roof, and we either needed a 30 panel (8.4kW) system or we would have had to be a bit more judicious in our power use to end up net-zero overall.

I still get a lot of non-use value from my solar array, and so my private return on investment is well in-the-black. It’s a bonus that the financial returns are a bit above the rates of interest on my mortgage, which is probably where we would have otherwise put the money we spent on the panels!
Have a great weekend.
In Alberta, you get paid the same price for what you buy and what you sell back. And, sorry if the data are not to your liking, but I've given you net power use over 5 years. If there is a different metric that you'd like to see, you could ask.
I'm on a club-ish rate with ACE.