
December 2nd

Happy Friday!
It’s been quite the week here in Alberta, and our weekly charts are posted at https://aleach.ca/charts.
As we head into December, the student story pipeline dries up a bit as, not surprisingly, they have other demands on their time, and so this week’s charts are story-free.
However, you still get a follow-up from me on a few things happening around Alberta.
First, after my rant of last week, Nigel Bankes flagged some important information in the Market Surveillance Administrator’s quarterly report for Q3 2022 that addresses some of the causes of high power prices in Alberta right now. Let’s start with gas prices: in last week’s rant, remember that I took issue with AESO CEO Mike Law’s characterization that “everybody knows, I think within Alberta, the price of natural gas has gone up fairly significantly over the last year or so. So input costs have gone up, as have carbon taxes that are applied to the large generators.” So, let’s look at how natural gas prices (red) have evolved since 2020 on the graph below vs. how power prices (in blue) have evolved. Even before the recent price spikes, the Alberta market had become decoupled from natural gas prices.
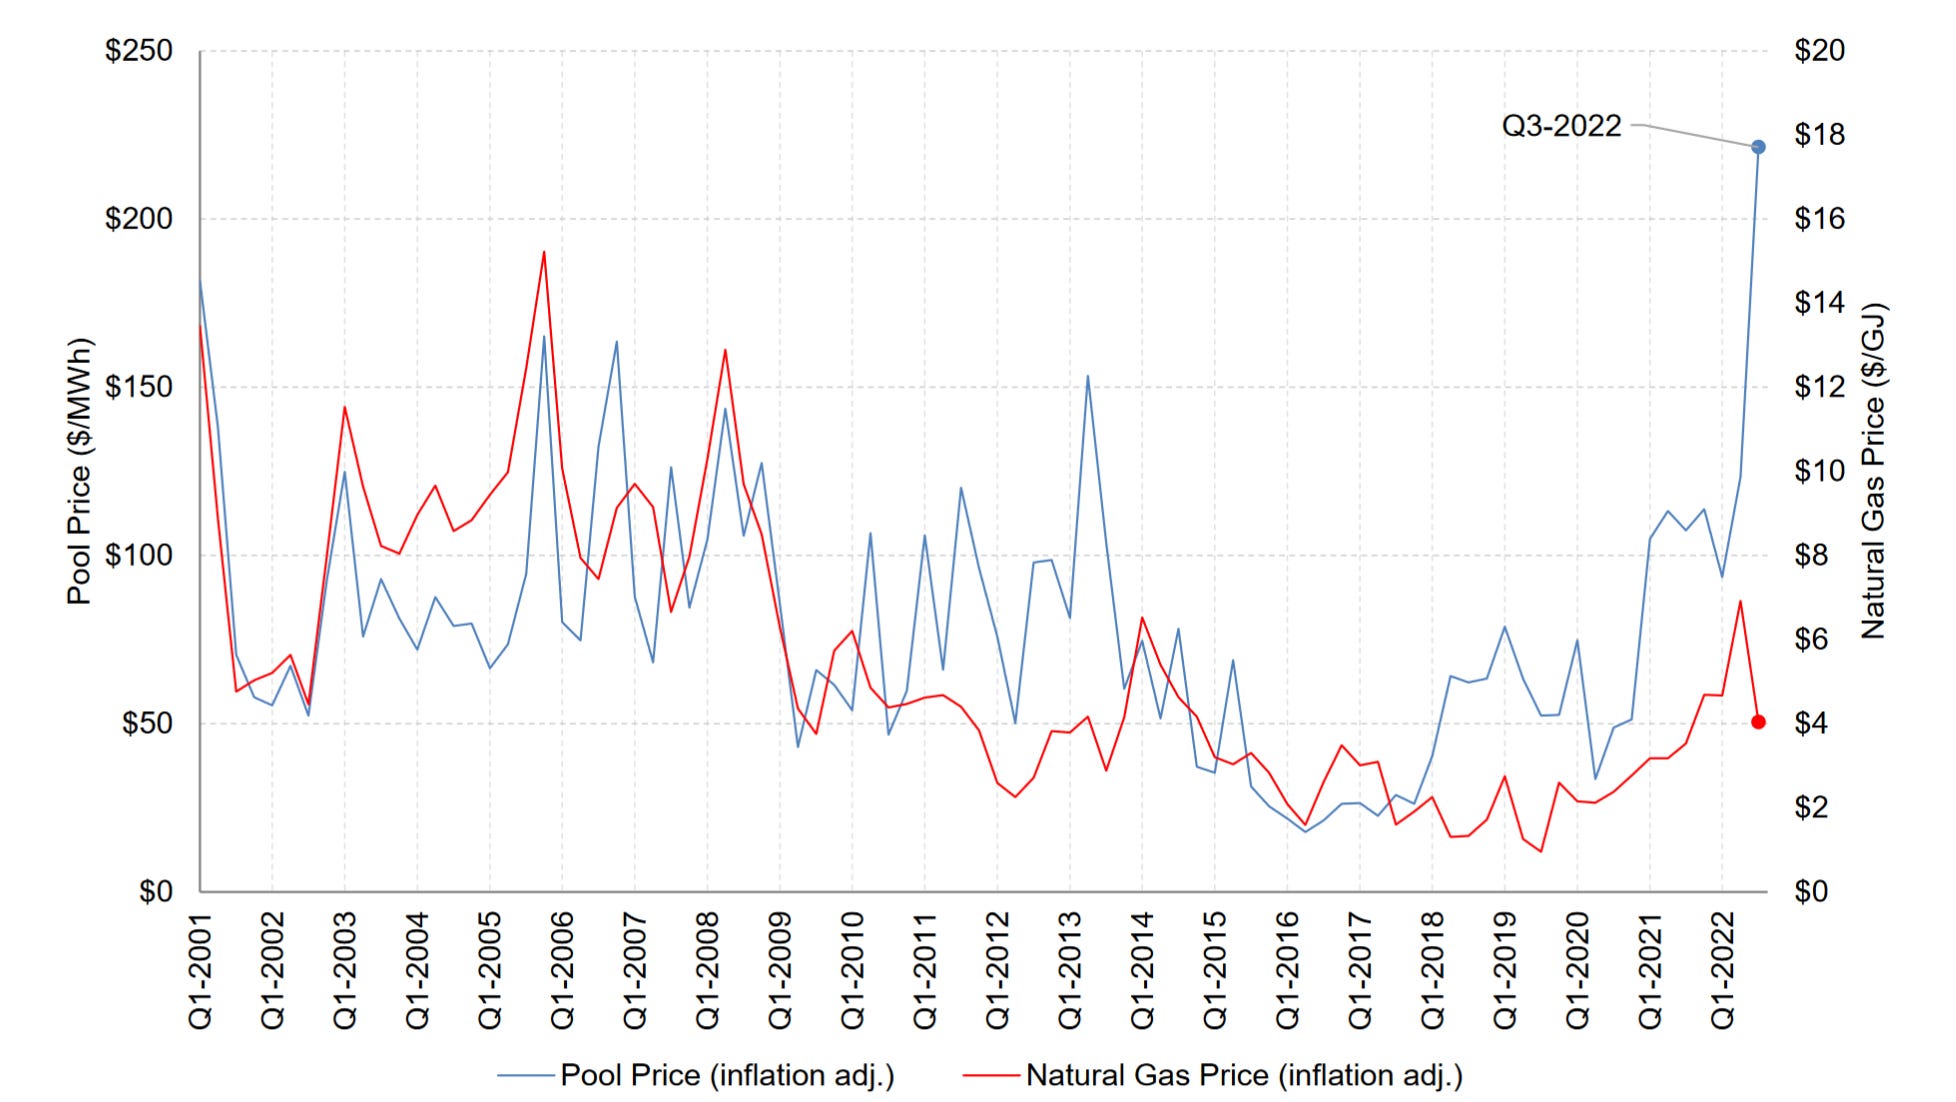
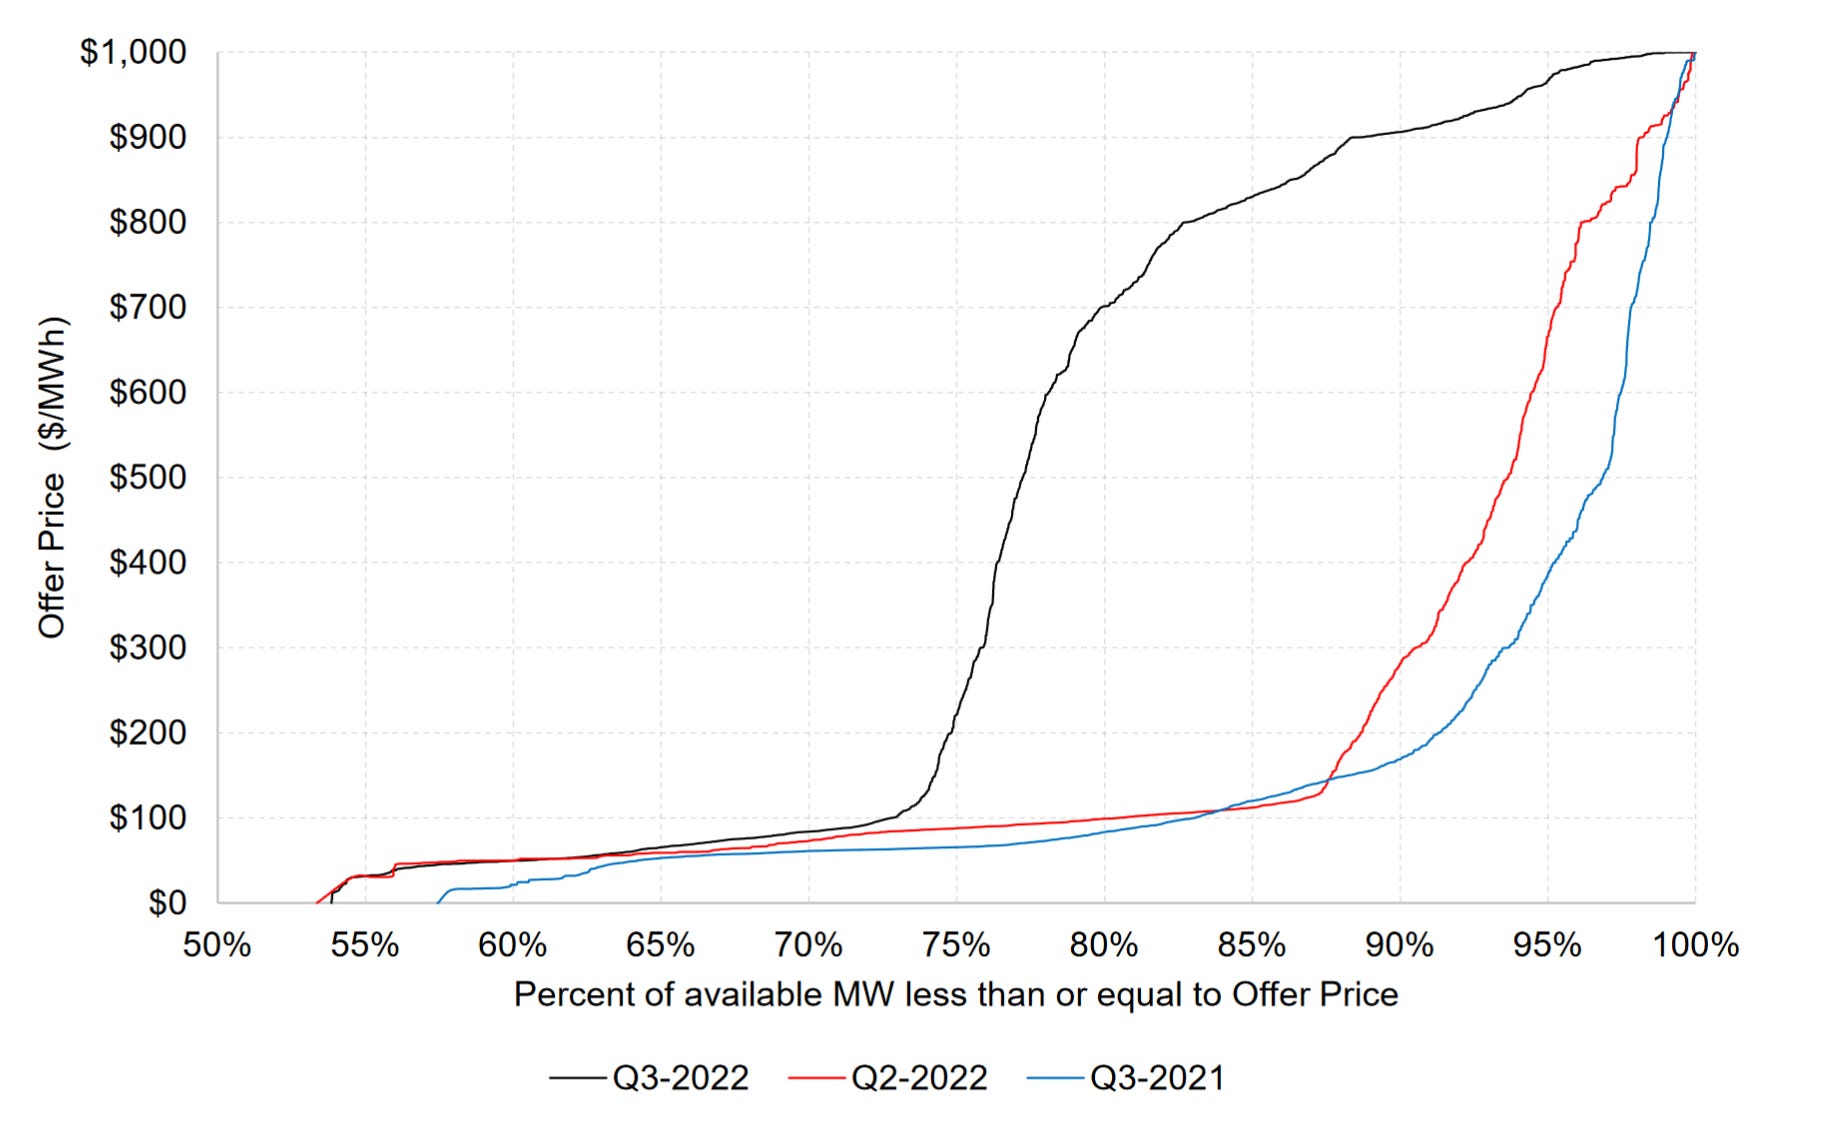
Natural gas prices are certainly up, but since early 2021, after the expiry of the last of the power purchase arrangements (PPAs), offers made by the largest firms in the market changed dramatically. You can see below how, almost overnight, this led to less capacity offered into the market at low prices.

And, another way to visualize this, we went from 88% of the market installed capacity available at prices less than $120/MWh last year to only about 73% of the market this year, and saw 20% of the market’s capacity offered in at prices above $700/MWh, compared to 5% of capacity a year earlier. Gas prices didn’t increase that much, Mike.
Carbon pricing provides another interesting angle. From 2021 to 2022, carbon prices did increase, by $10 per tonne to $50/tonne in Alberta. The average emissions intensity in the province has been dropping rapidly, and this year ranged from 0.4 to 0.6 tonnes per MWh. All participants are eligible for carbon credits at a rate of 0.37t/MWh, so that means that the total impact of the carbon price on average costs ranged between $0 and $12/MWh during Q3 2022, basically the same as the range from 2021 when emissions were higher but nominal carbon prices were lower. If you’re looking for what’s causing triple-digit increases in power prices, it’s not carbon pricing.

All the figures above are sourced from the MSA. And, to be clear, there is nothing wrong with firms charging more for electricity and taking profits in times of market tightness: that’s how our system is designed. But, the system operator should either take a pass on commenting on market price outcomes or should be honest with Albertans about what’s truly behind the cost increases and what the evidence truly shows is that it’s market concentration and more economic withholding.
The good news for consumers, if there is any this week, is that the power forwards were down a bit for the coming couple of months.
Other news this week:
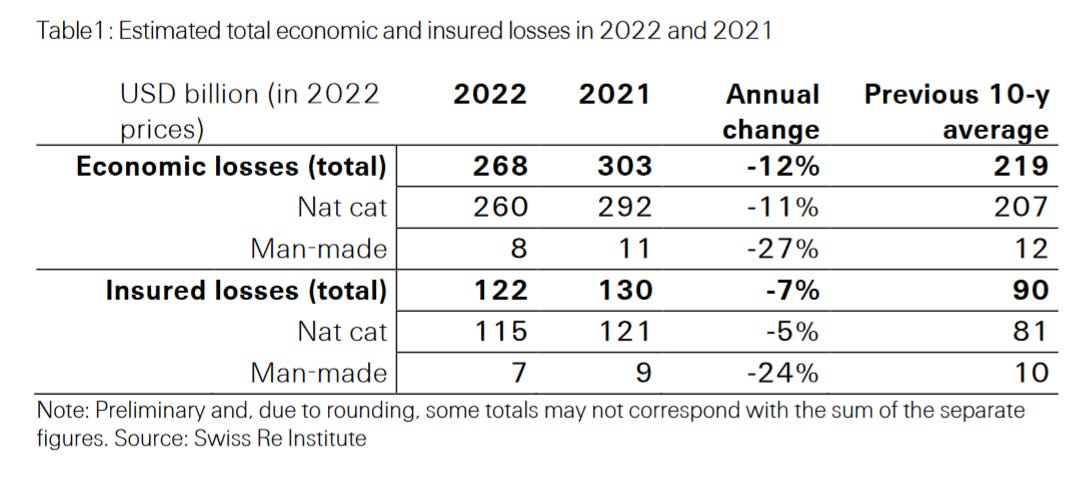
On the climate-change front, re-insurance giant Swiss Re issued its estimate of $115 billion of insured losses from natural disasters this year, a bit below last year, but well above the 10-year average (h/t
).
In oil markets, we saw agreement today on a Russian oil price cap, which seems unlikely to change a lot in crude markets overall. We might see more action after the OPEC+ meeting on December 4th in terms of overall reaction.
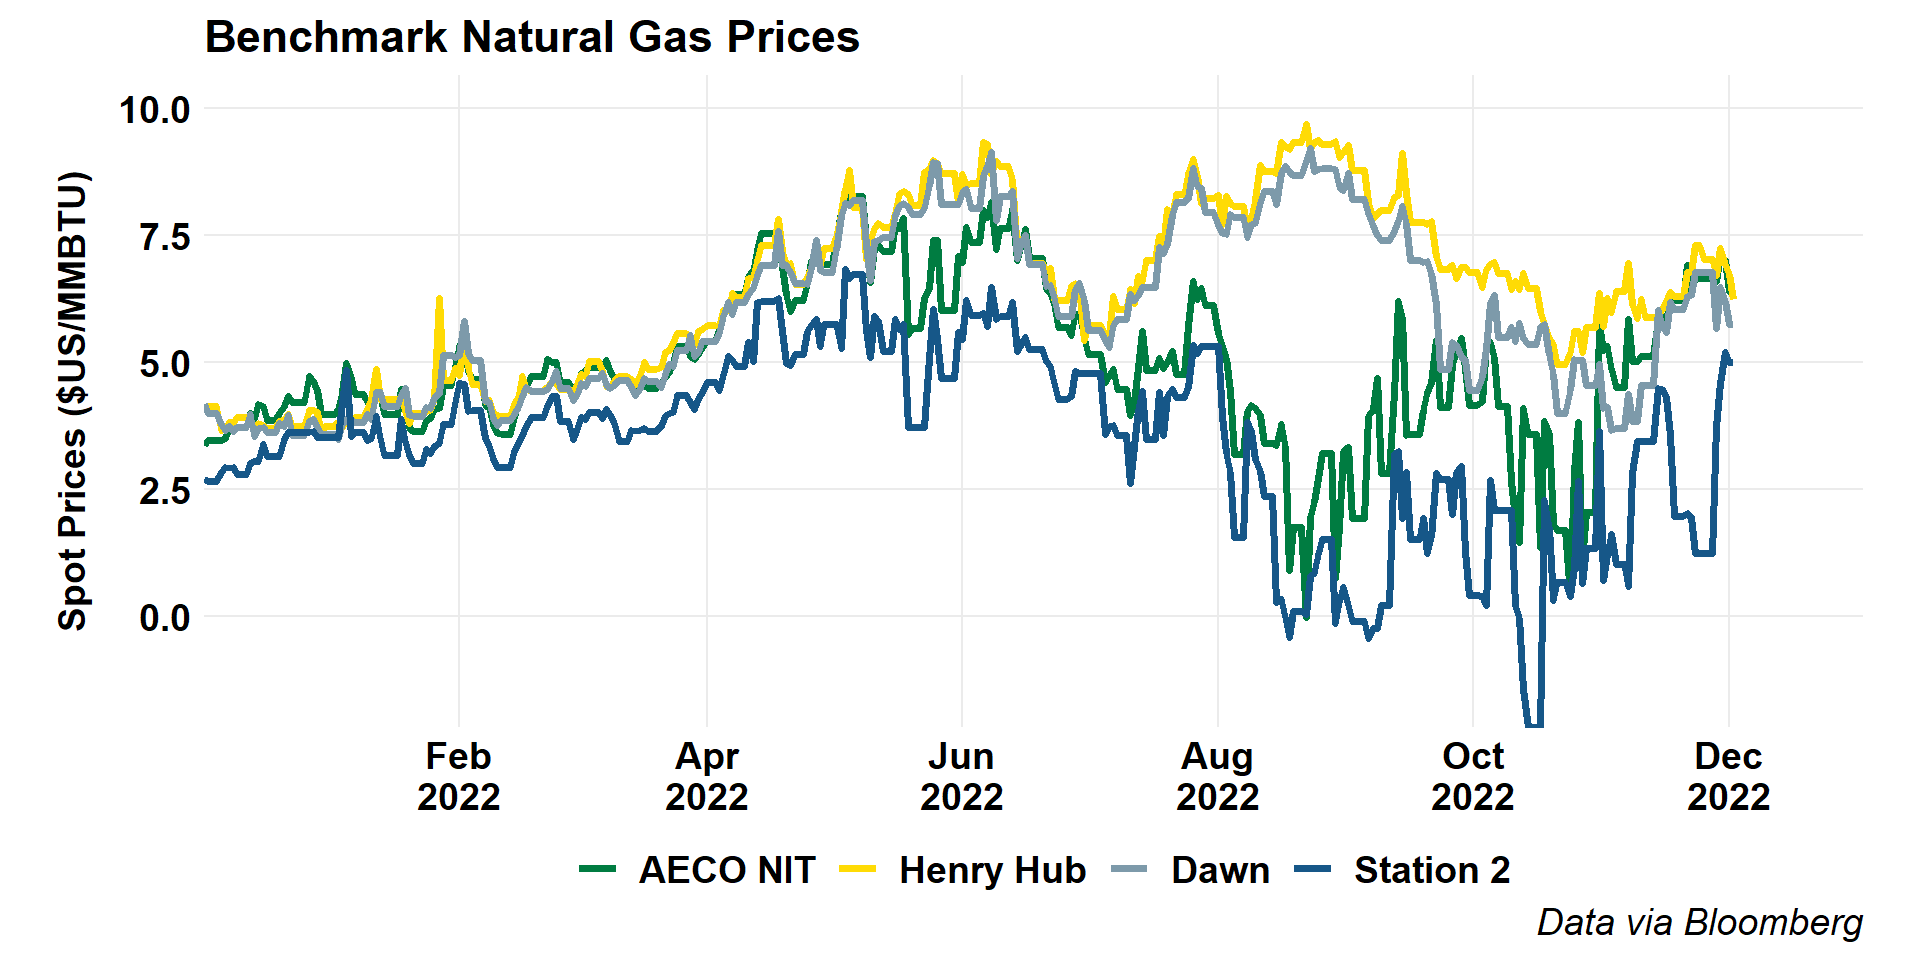
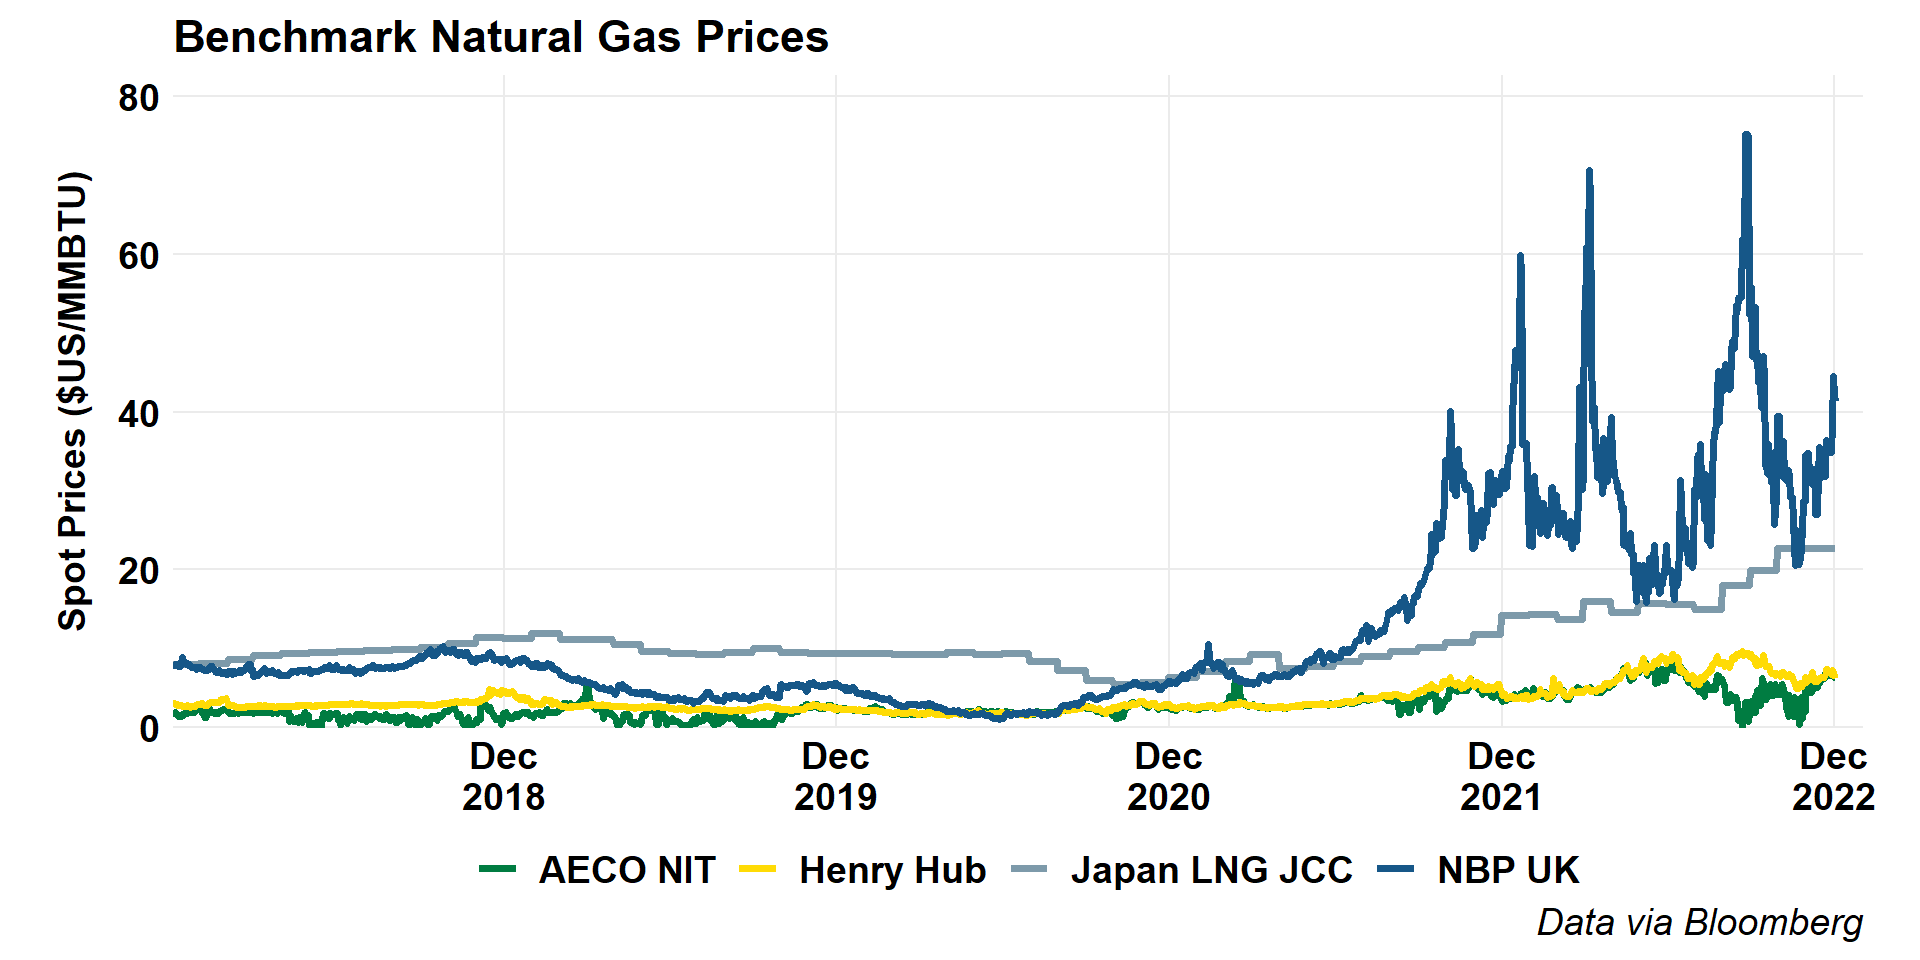
In gas markets, the AECO-NIT resurgence continues, with prices now back to par or close to it with Henry Hub, and even Station 2 showing lower basis differentials than we’ve seen for some time.
Globally, we’ve seen a renewed increase in European gas prices and a continued slow climb in Asian LNG settlements.
And, domestically, gasoline prices continue to moderate dramatically (not as much when measured in Bitcoins/litre, mind you) while diesel (ex Ontario, where prices have come down) remains high.
Finally, for this week, a bit of an Alberta fiscal update. I think this graph says it all.

One of my enduring theories of Alberta politics was broken this year, as confirmed by the November 24th fiscal update. Historically, the Premiers who saw significant per-capita real revenue growth are the legends, Klein and Lougheed, while others who saw revenue stagnate or decline are unpopular or worse. However, Jason Kenney seems poised to have broken that trend with both the highest rate of growth and highest level of per-capita government income during his time as Premier. I’ll share a graph of that with you all next week after I port all this data to R.
Have a great weekend.
Andrew