After some delay...
Charts, charts, and more charts.

Well, it finally caught up to me.
This term was always going to be a tough one, as my change of jobs at the University of Alberta meant two new course preps this term. I’d been doing well at keeping all the balls in the air until…this week. A midterm for my undergrad energy economics students and a new chunk of prep for my law class that took me down several utilities law rabbit holes, along with testimony to the Senate Energy, Environment and Natural Resources committee on Tuesday saw my charts update get pushed to the back burner.
Today, I have updated the charts online at https://aleach.ca/charts and we have three stories this week from Kayla on the Keystone spill, from Marc on the EU response to the IRA, and from Yousaff on a second life for EV batteries.
For my part, I have five charts for you. First off, with missing last week, I missed my usual EIA STEO update on oil demand.
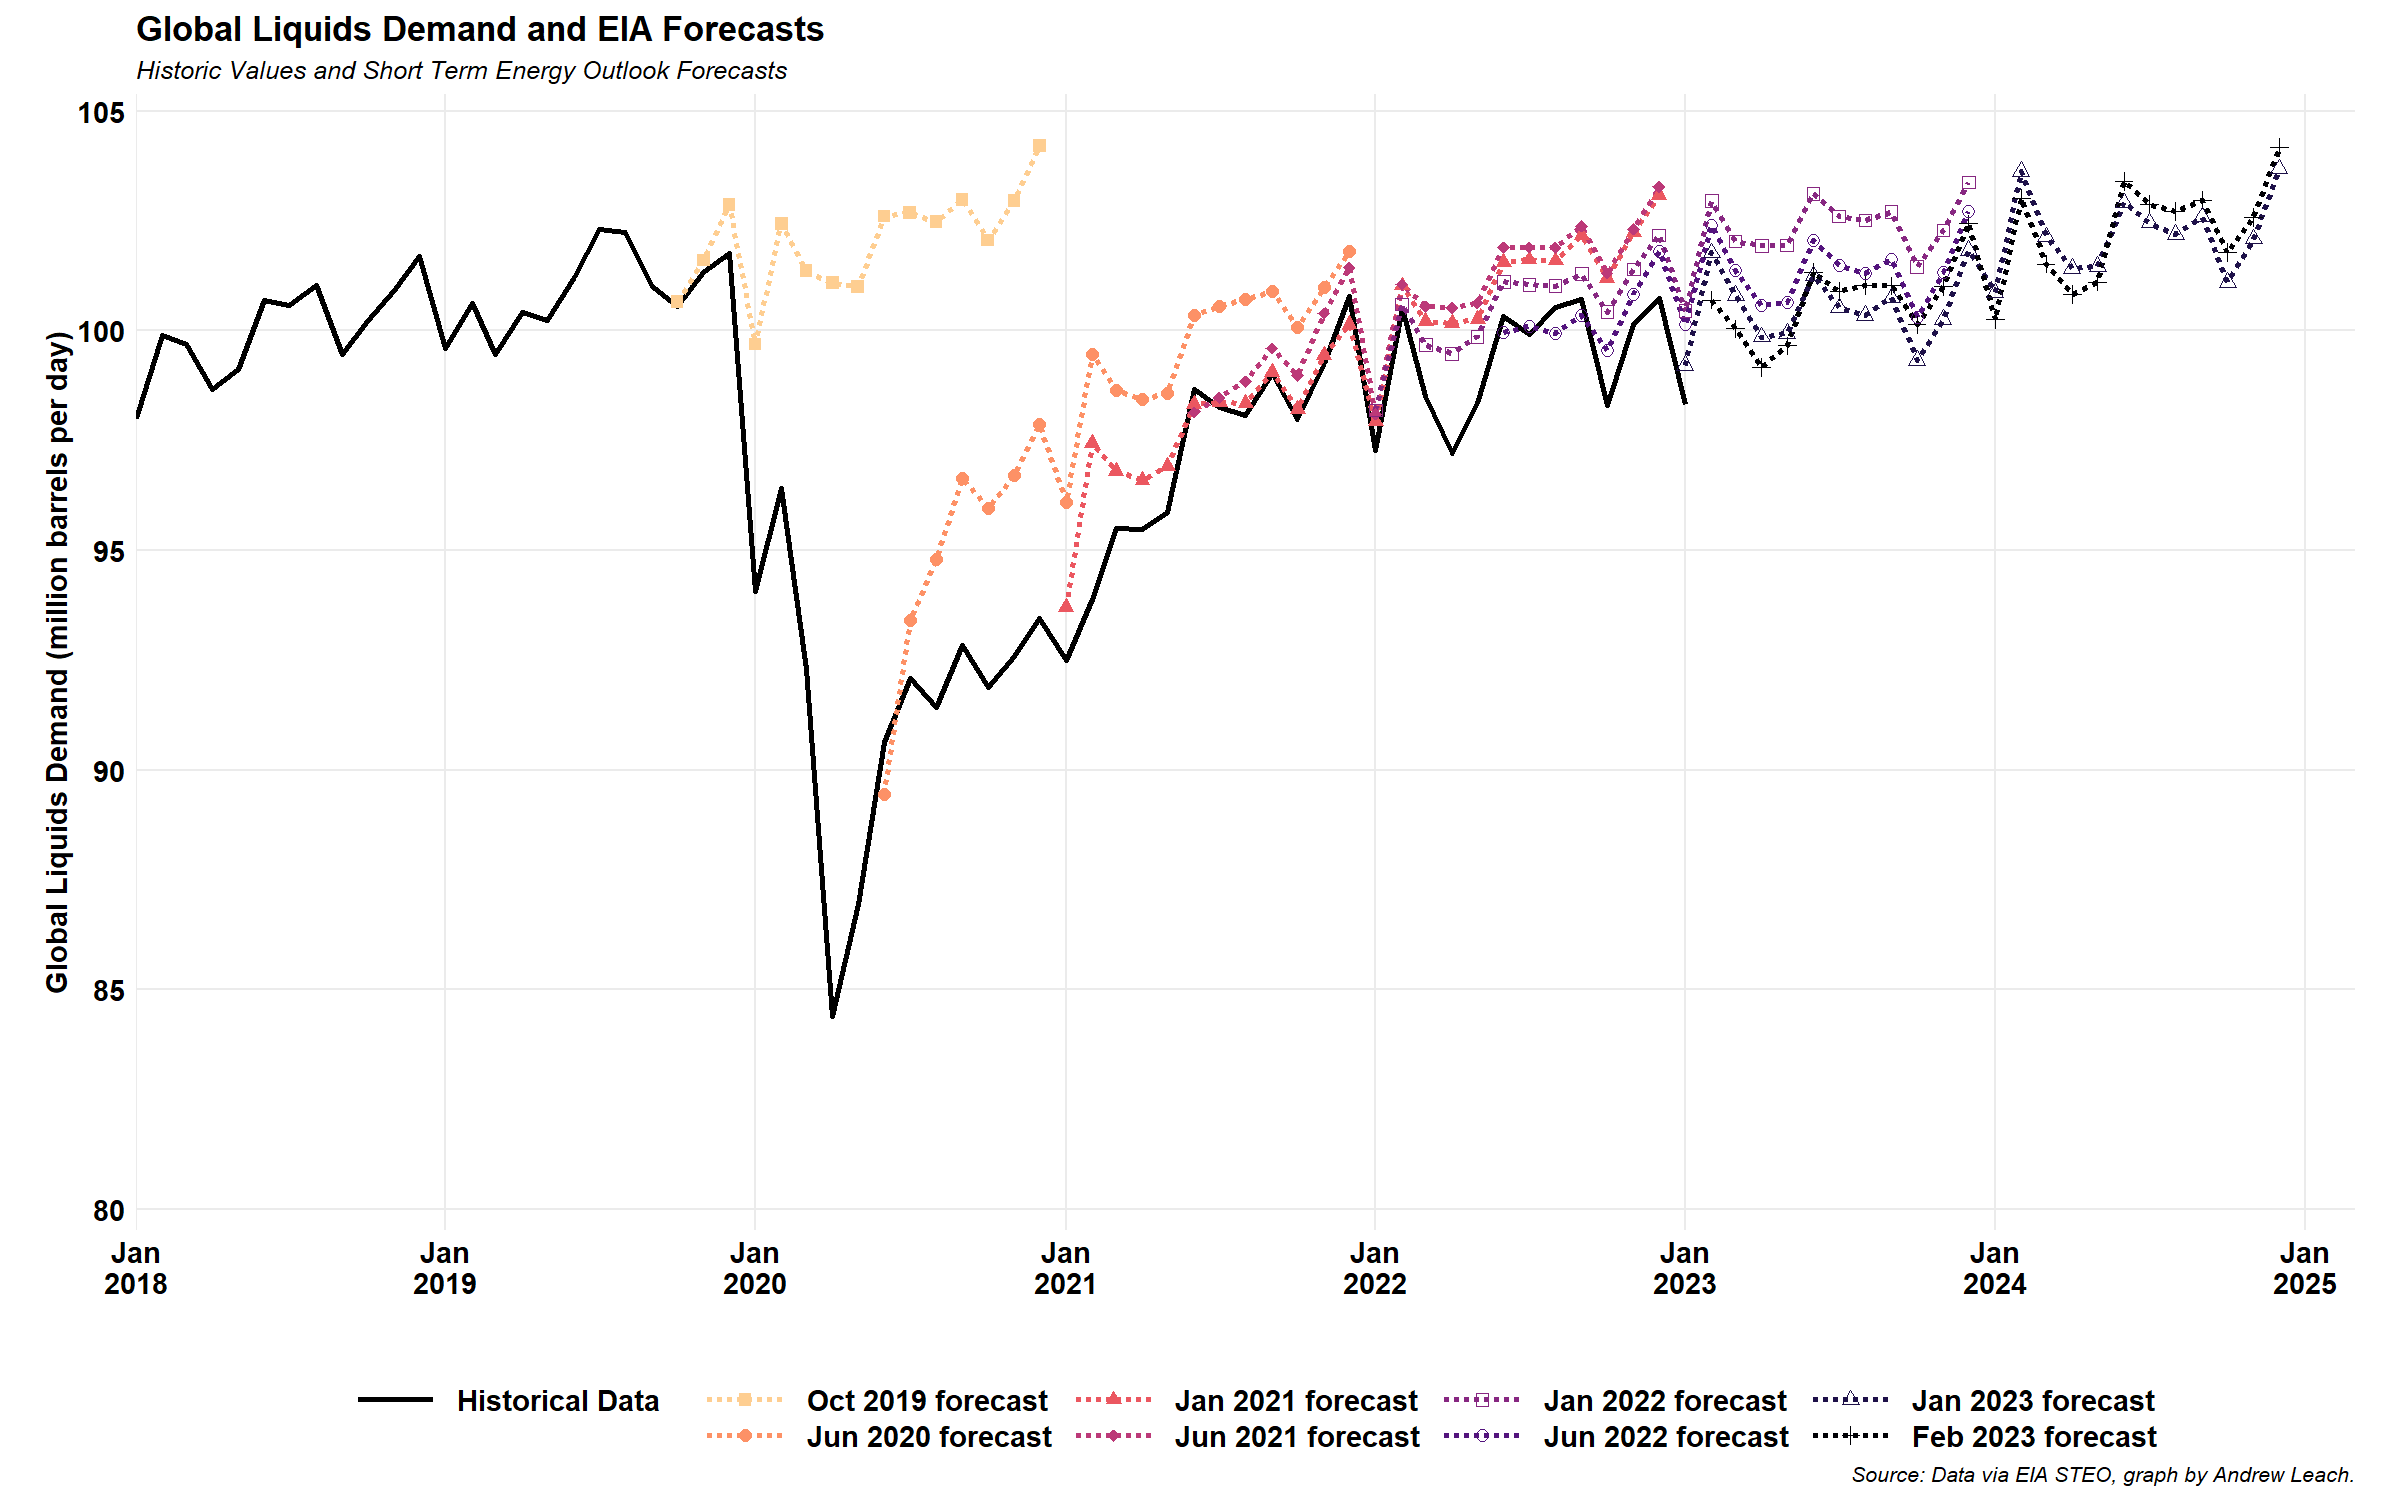
This month brings an interesting new twist: bearish short-run, with a little more bullish long term, with one of the first upward revisions since I started tracking the STEO forecasts carefully though COVID. We’re still seeing a 4 year delay to get back to where the oil market was expected to be by 2021, so when you’re told that oil demand is growing, keep this chart in mind.
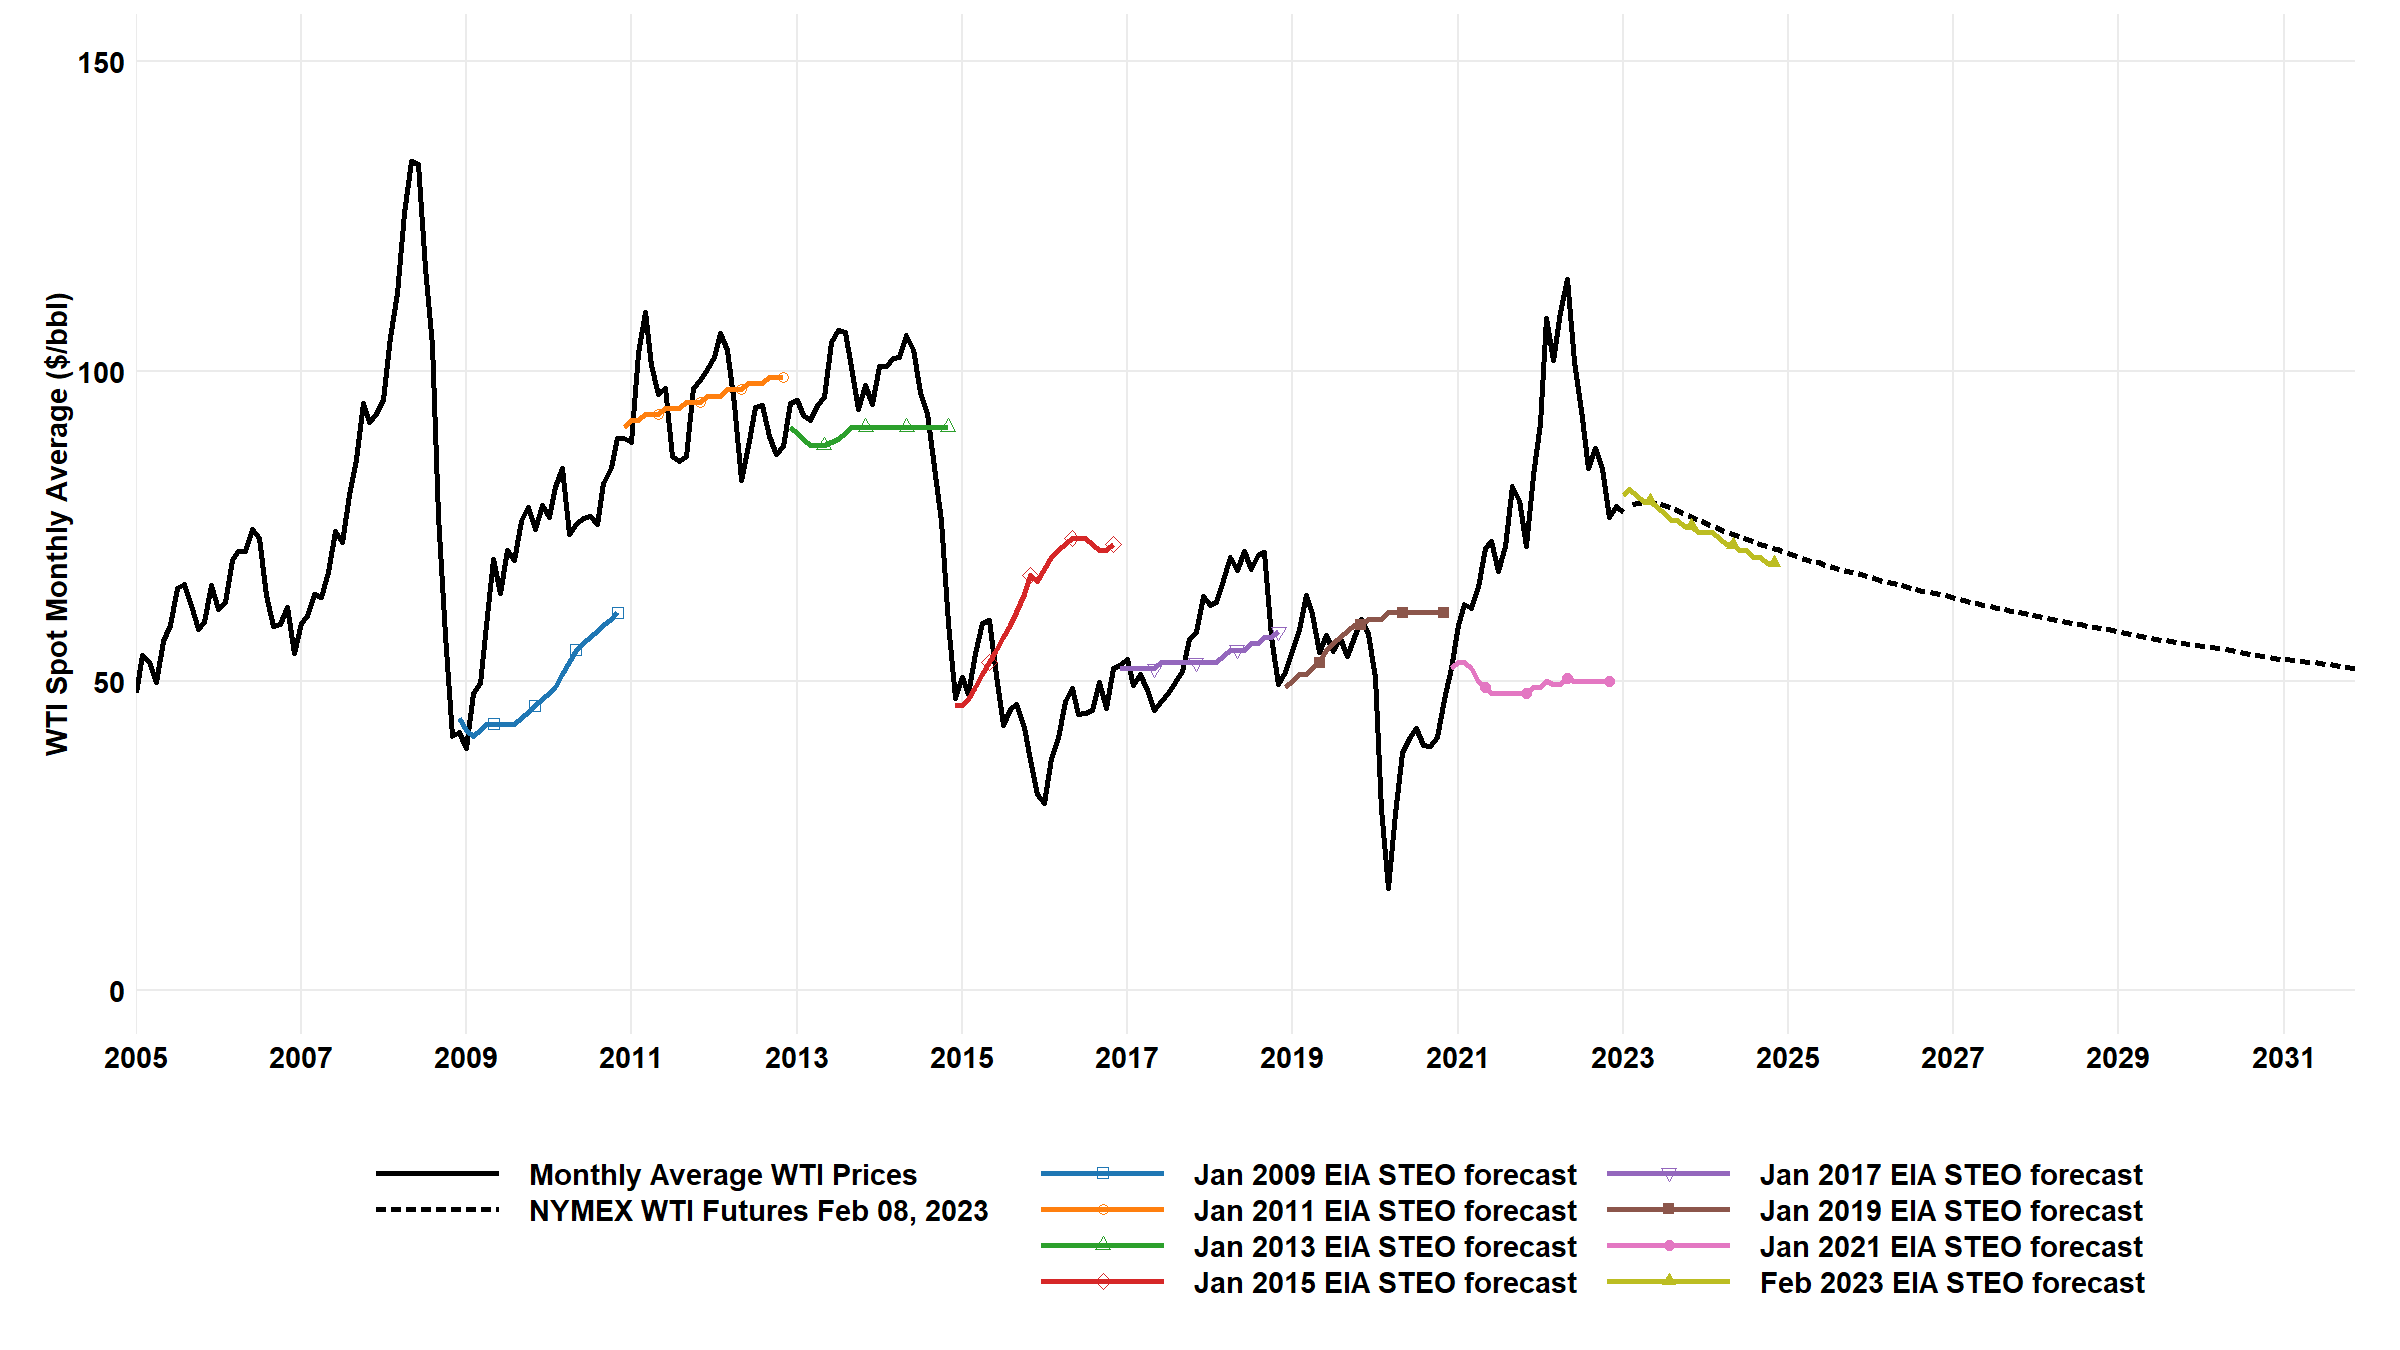
The STEO WTI forecast was also a bit bearish relative to the (very bearish already) WTI forwards, although prices are still well above where expectations would have been at any time from 2016 through 2021.
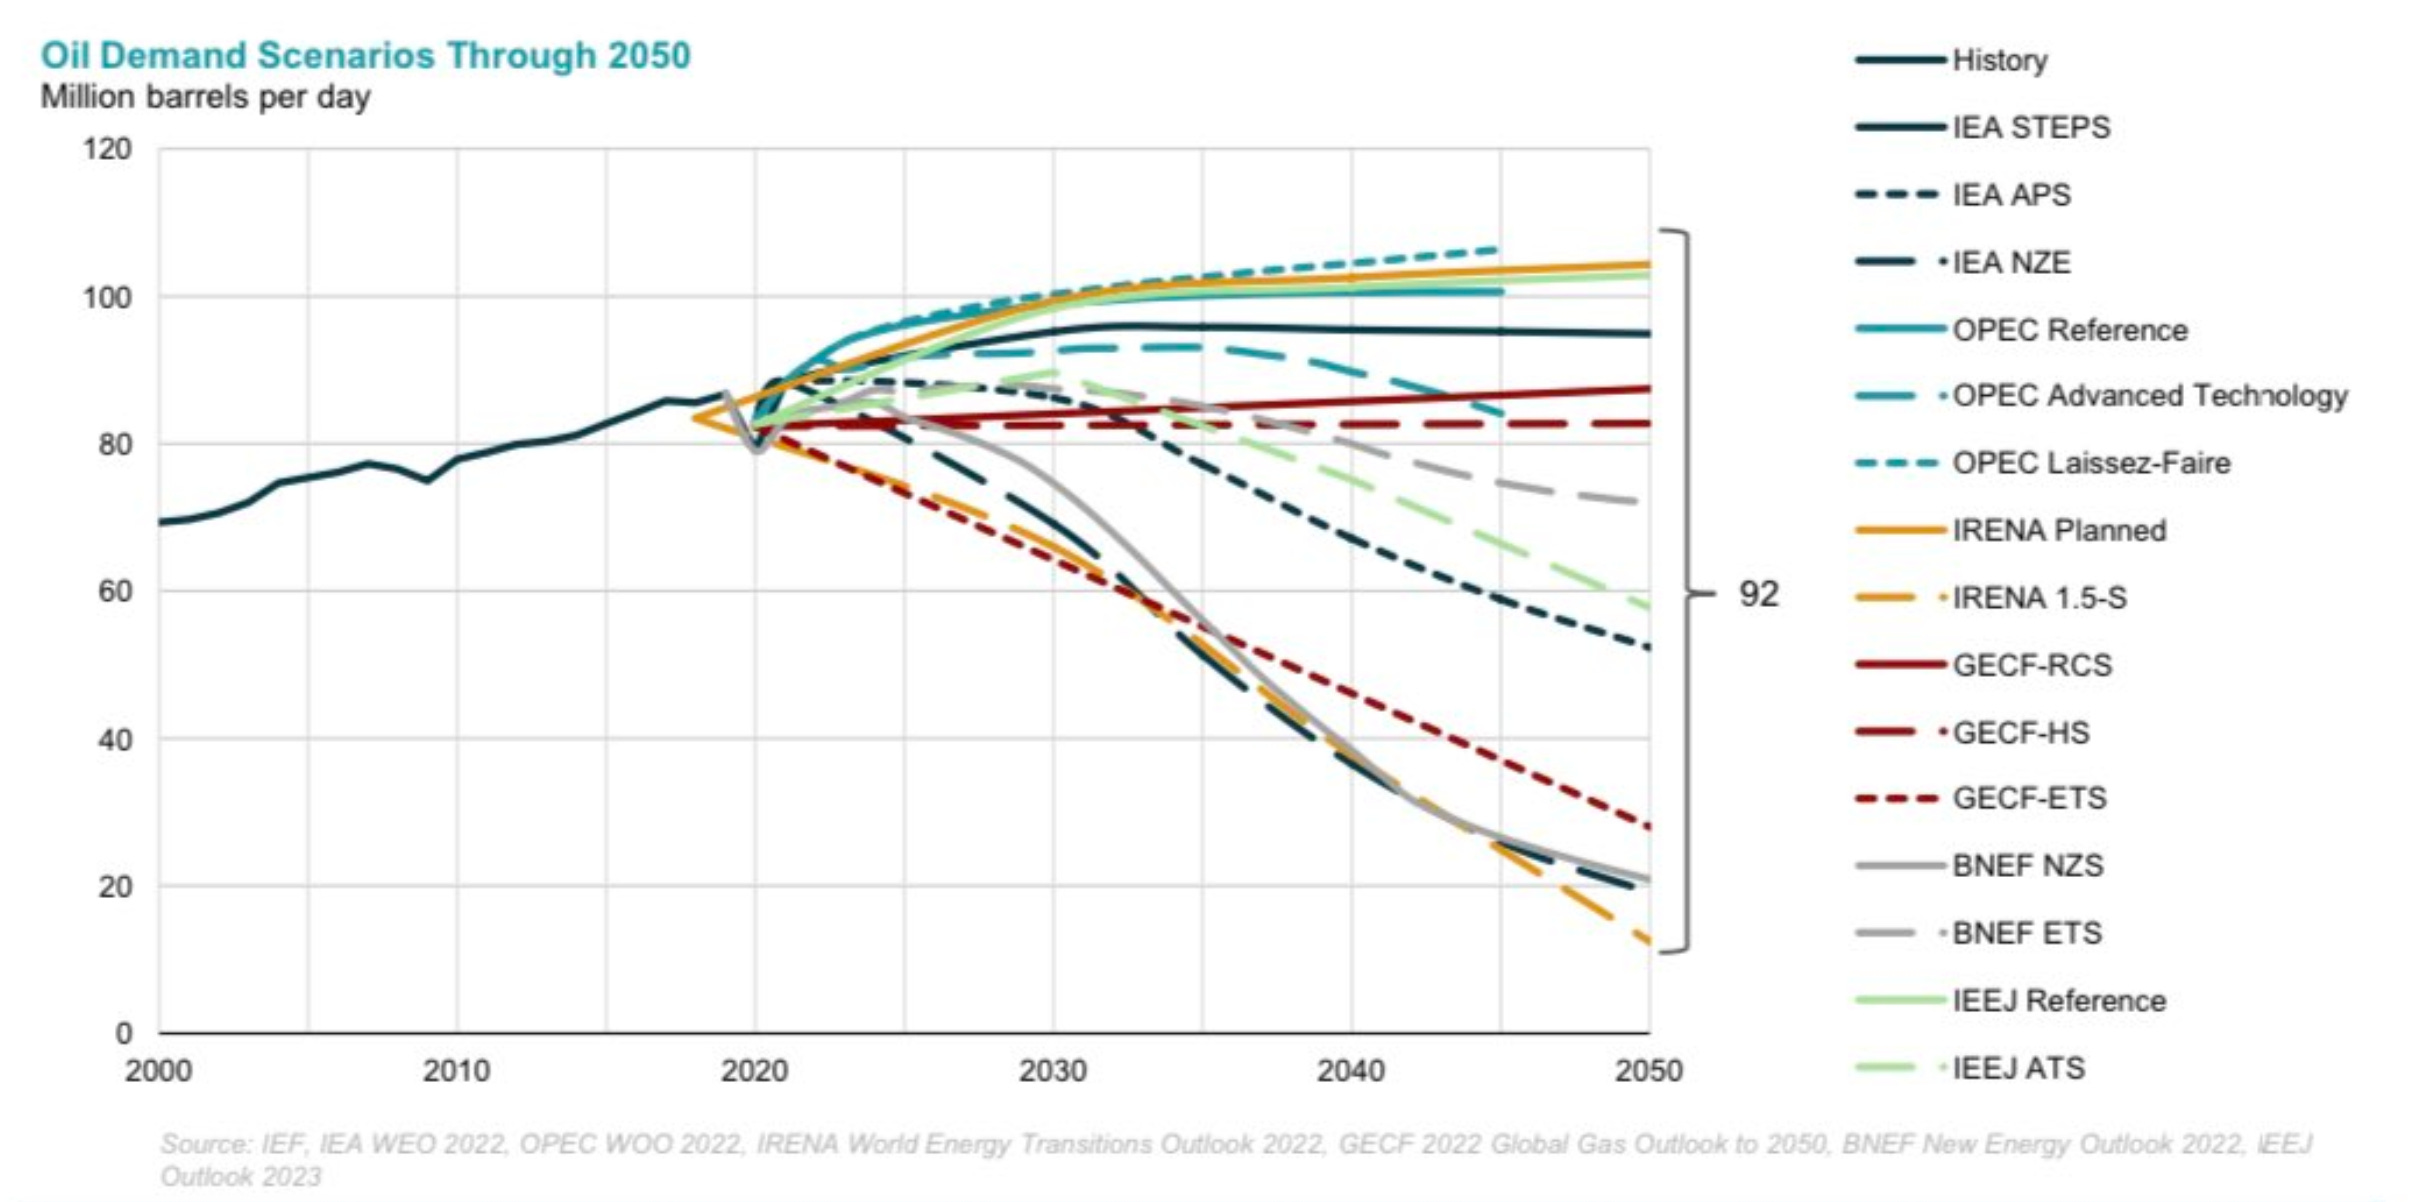
The second and third charts are from a new report find for me: the International Energy Forum (IEF), via former EIA oil analyst Mason Hamilton. The first of the charts from the IEF this week is a look at other global oil market assessments. Yes, there are some that do show oil demand climbing substantially from current levels. But, I’m not sure that’s the key take-away given some of the very deep cuts in demand forecasts across scenarios modeling any form of aggressive action on climate change.
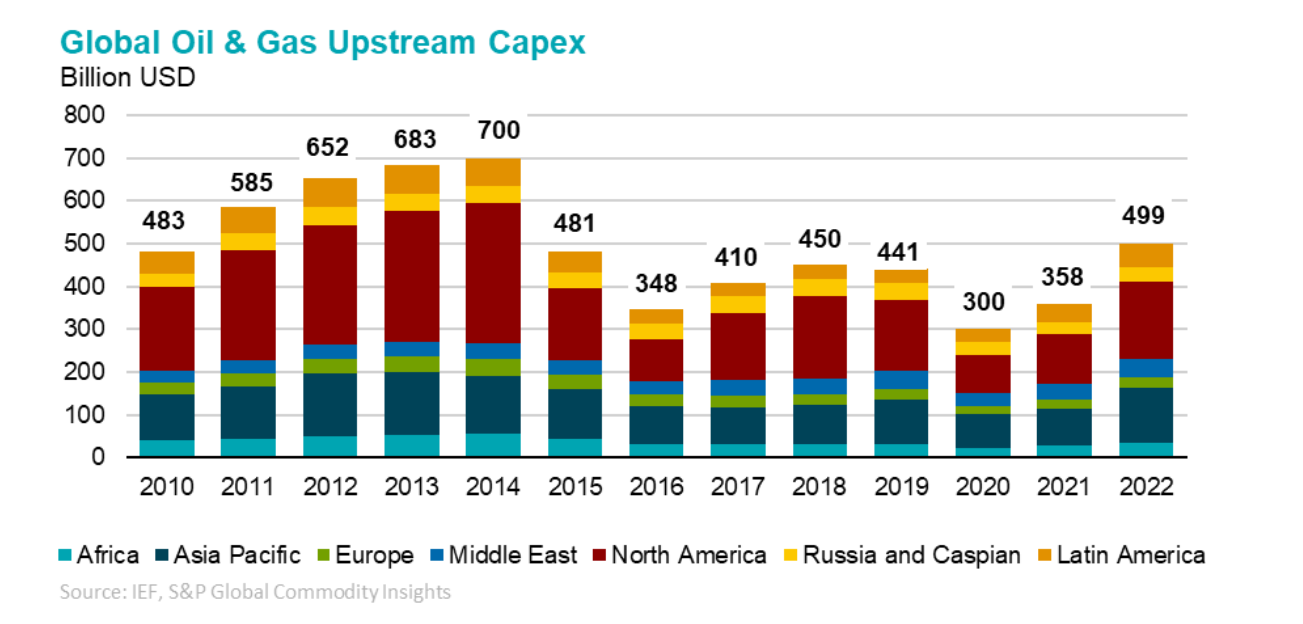
The second graph, from the IEF’s Upstream Oil and Gas Investment report, shows just how big the drop in global investment has been since 2015. This mirrors EIA data, but the EIA hasn’t yet published their full-year 2022 figures.
We hear a lot in Canada about the impact of the Trudeau government, legislation like C-69, carbon taxes, etc. on oil and gas investment. Don’t be fooled into thinking that correlation implies causation. Unless, of course, you think that the Trudeau-Notley alliance had a global impact that saw oil and gas investment cut more-or less in half relative to the business-as-usual trend.
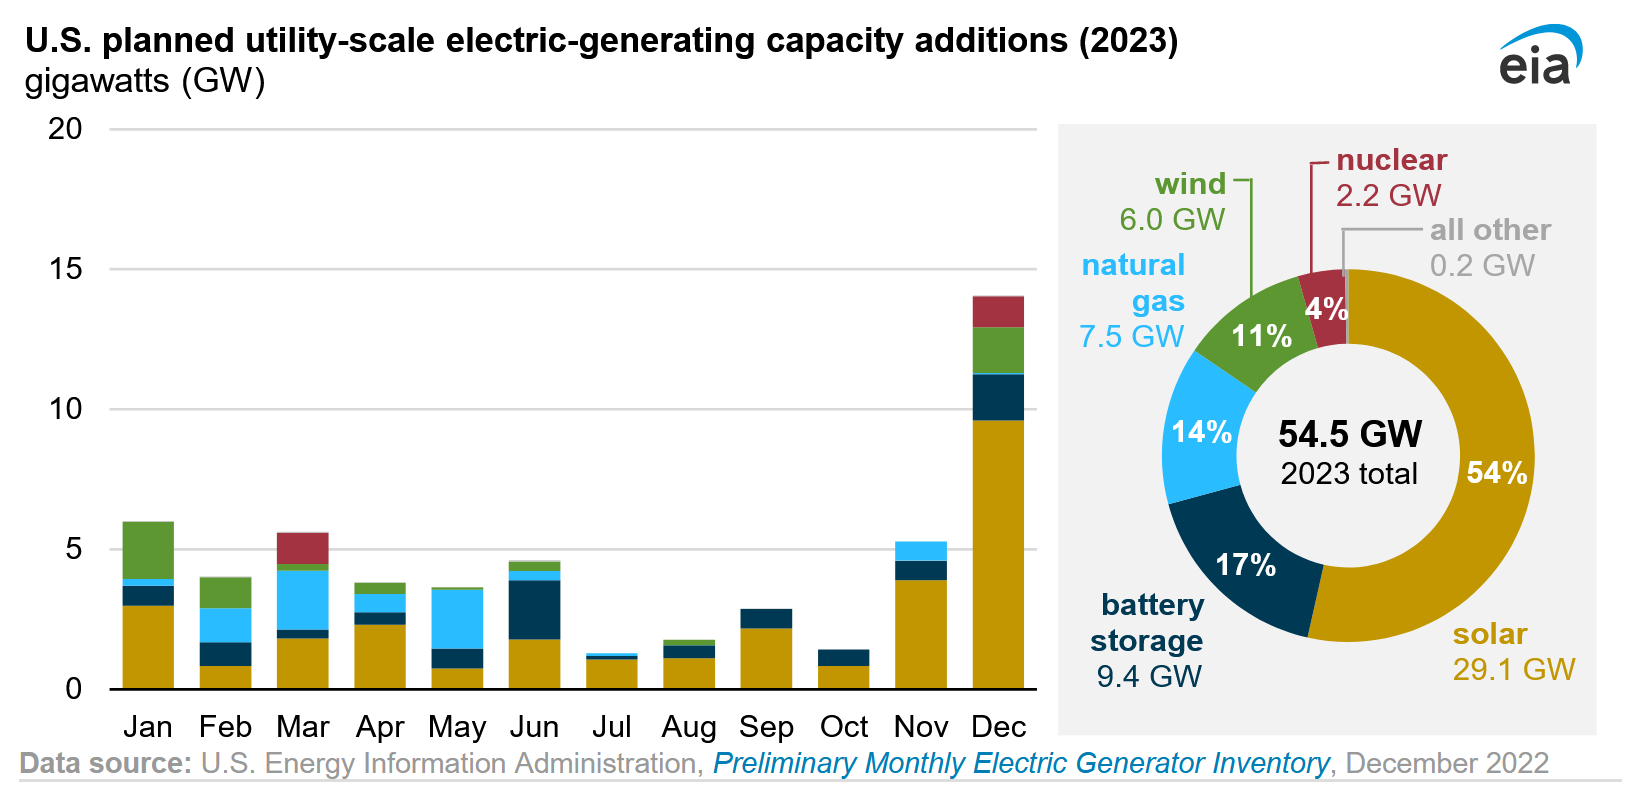
And, finally, a new one today from the EIA. Despite the efforts of nearly every reply-guy on the internet, investors still seem oblivious to the fact that the sun doesn’t shine all the time (yes, Friends o’ Science, that was sarcasm). Today’s EIA update shows that more than half of new electricity generating investment in 2023 will be solar, and 86% of new capacity will be emission-free (or close to it). Things are sure changing quickly!
That’s all for me for this week.